 IEEE/ICACT20230158 Slide.04
[Big Slide]
[YouTube] Oral Presentation
| Virual Oral Presentation Slide by Slide |
|
IEEE/ICACT20230158 Slide.04
[Big Slide]
[YouTube] |
Oral Presentation |
|
|
|
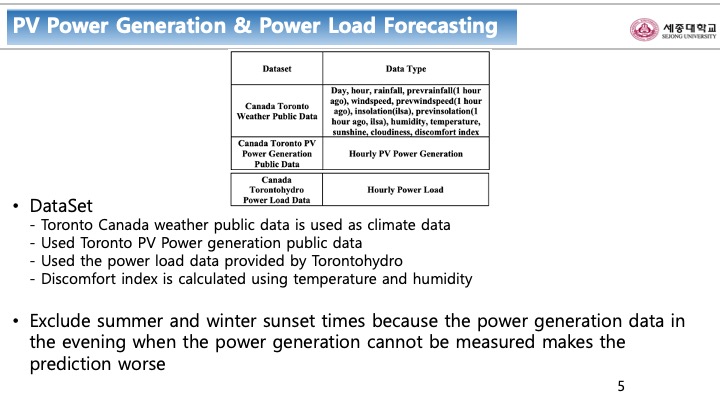
The table is the dataset we used in this paper. There are a total of three data sets using weather data, PV Power Generation data, and Power load data. We add the discomfort index from the weather data. The discomfort index was calculated using temperature and humidity. We excluded summer and winter sunset times because the power generation data in the evening when the power generation cannot be measured makes the prediction worse. | |
| [Go to Next Slide] |