 IEEE/ICACT20260100 Slide.05
[Big Slide]
Oral Presentation
| Virual Oral Presentation Slide by Slide |
|
IEEE/ICACT20260100 Slide.05
[Big Slide]
| Oral Presentation |
|
|
|
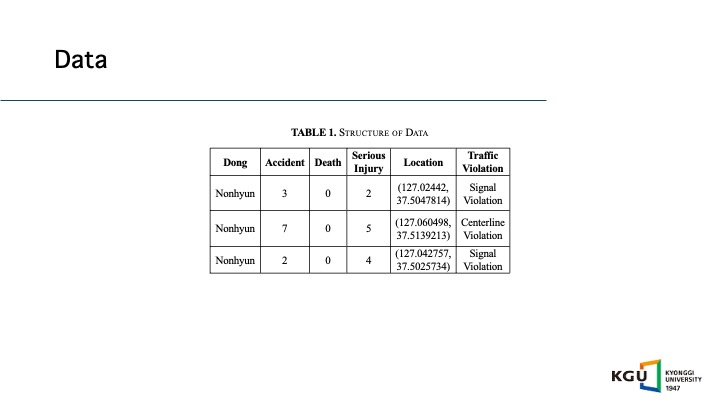
Table 1 presents the structure of the data. Each row in the dataset represents a traffic accident in each hot spot site corresponding to a specific type of traffic violation. For example, the first site is located in Nonhyeon-dong, where three traffic accidents occurred, all of which involved traffic signal violations. | |
| [Go to Next Slide] |