 IEEE/ICACT20260100 Slide.06
[Big Slide]
Oral Presentation
| Virual Oral Presentation Slide by Slide |
|
IEEE/ICACT20260100 Slide.06
[Big Slide]
| Oral Presentation |
|
|
|
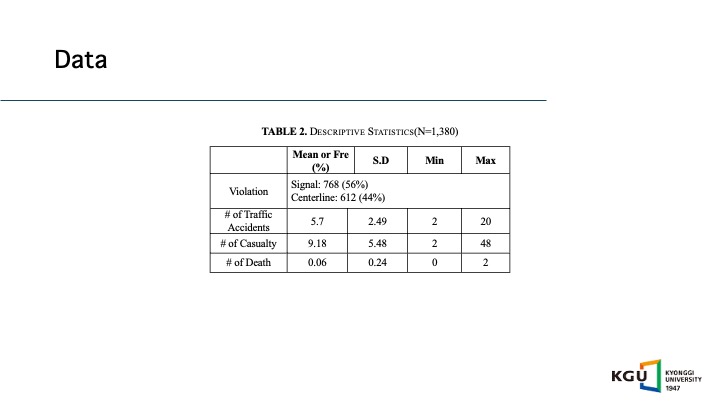
Table 2 presents the descriptive statistics illustrating the characteristics of the data. Among the 1,380 traffic accident hot spot sites, 56% involved signal violations, while the remaining 44% involved centerline violations. On average, each site experienced 5.7 traffic incidents over the seven-year period. The average number of casualties per site was 9.18, ranging from a minimum of 2 to a maximum of 20. | |
| [Go to Next Slide] |