 IEEE/ICACT20210130 Slide.07
[Big Slide]
Oral Presentation
| Virual Oral Presentation Slide by Slide |
|
IEEE/ICACT20210130 Slide.07
[Big Slide]
| Oral Presentation |
|
|
|
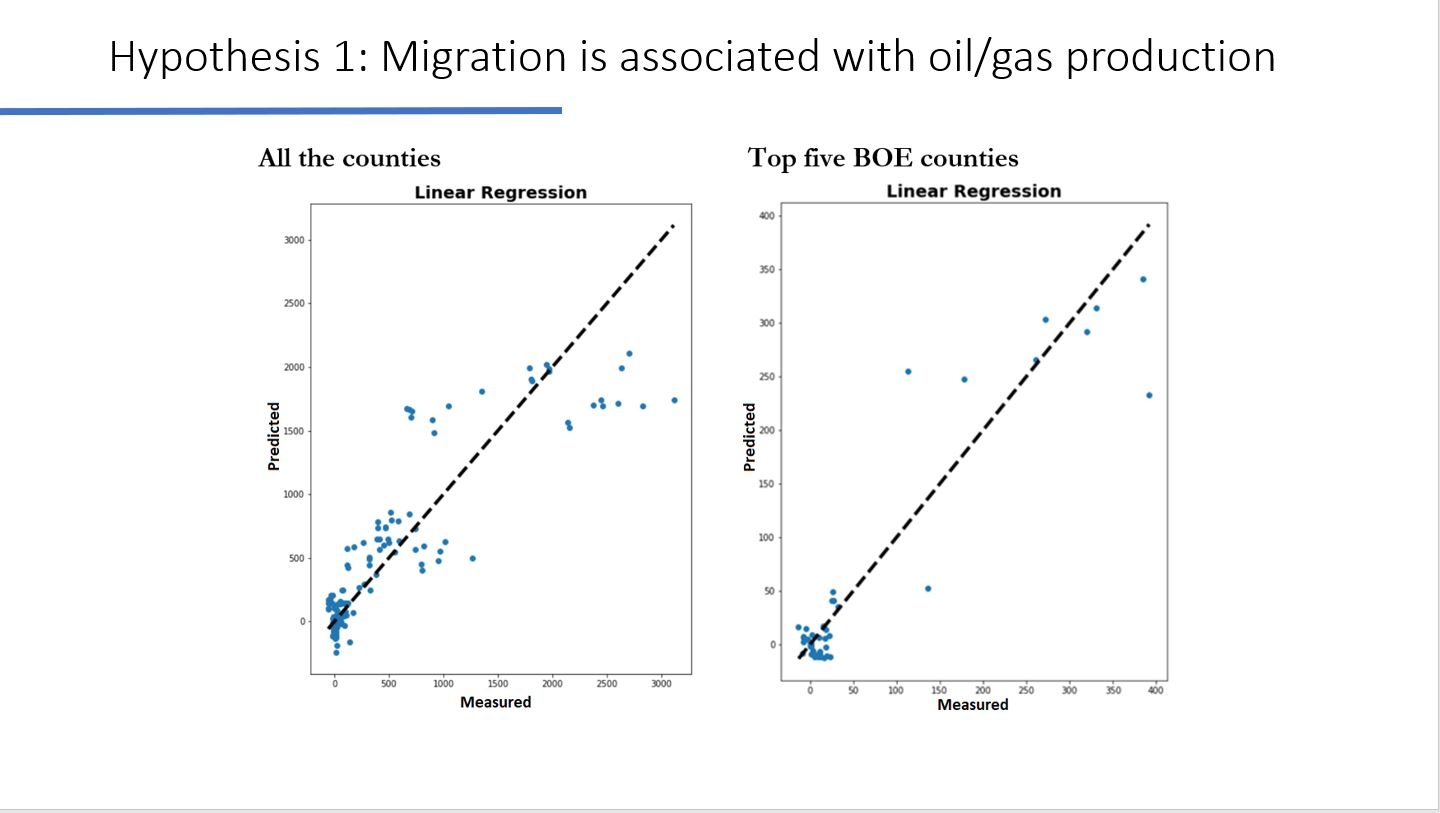
Shown here is the linear Regression result using all the counties (left image) versus only the top 5 producing counties shows that our hypothesis of migration and oil/gas production is associated. The model has an adjusted R-square of 0.845. | |
| [Go to Next Slide] |