 IEEE/ICACT20210130 Slide.08
[Big Slide]
Oral Presentation
| Virual Oral Presentation Slide by Slide |
|
IEEE/ICACT20210130 Slide.08
[Big Slide]
| Oral Presentation |
|
|
|
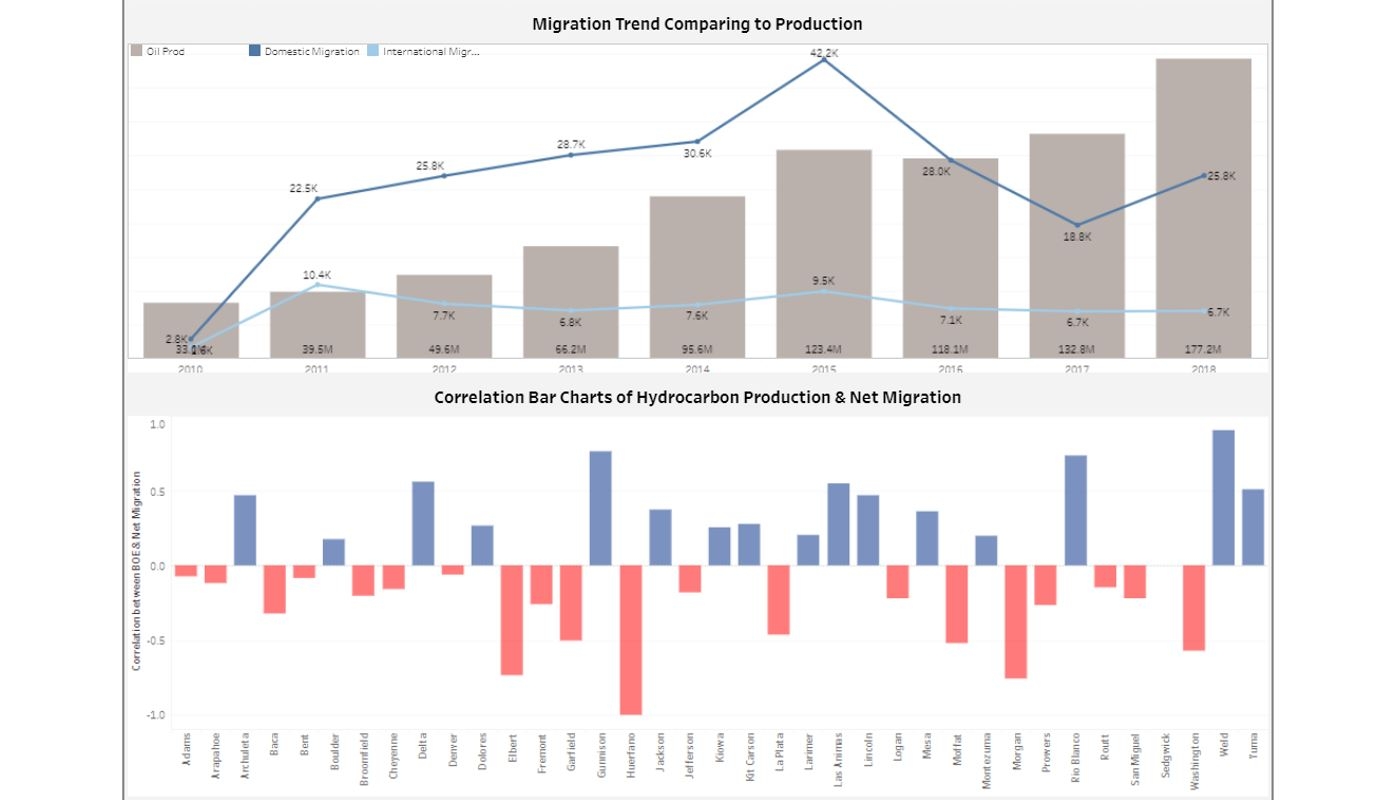
Two visualization analyses are shown here. The top figure compares domestic migration (deep blue) and international migration (light blue) with the oil production revenue. In general, it demonstrates a positive correlation. The bottom figure shows Pearson correlations of hydrocarbon production and net migration, but the association's direction varied across different counties. | |
| [Go to Next Slide] |