 IEEE/ICACT20210239 Slide.08
[Big Slide]
Oral Presentation
| Virual Oral Presentation Slide by Slide |
|
IEEE/ICACT20210239 Slide.08
[Big Slide]
| Oral Presentation |
|
|
|
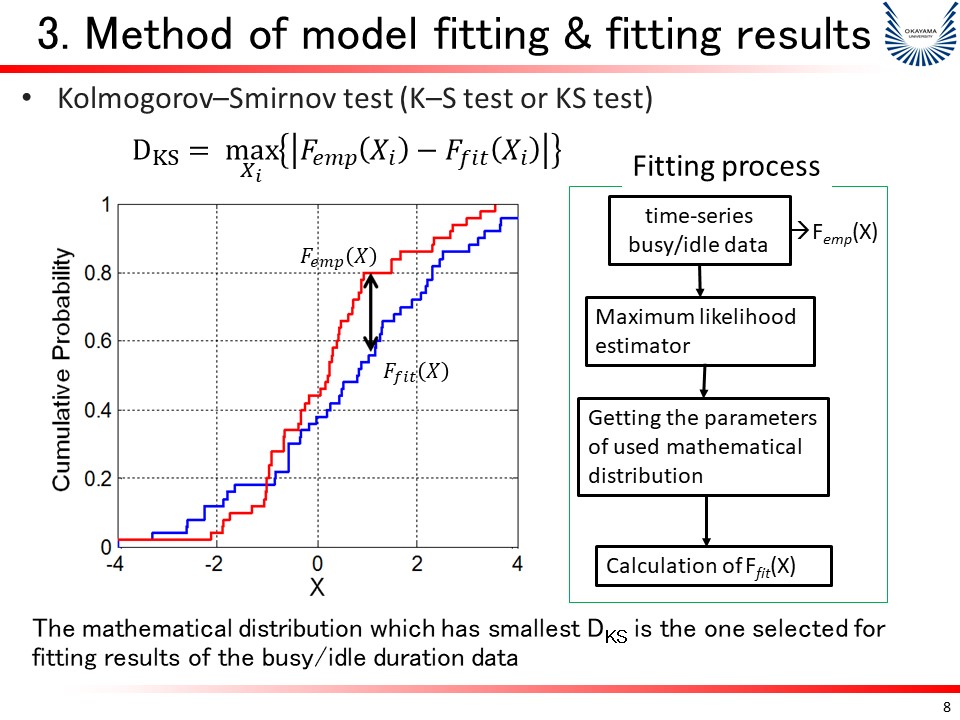
To show the level of fitting results, we calculate the K–S test value DKS between the empirical data and the selected mathematical distribution function with the equation showed here. The fitting process is based on the MLE rule to calculate the parameters of each mathematical distribution function which given with this flowchart. Finally, the mathematical distribution which has smallest DKS is the one selected for fitting results of the busy/idle duration data | |
| [Go to Next Slide] |