 IEEE/ICACT20230036 Slide.08
[Big Slide]
[YouTube] Oral Presentation
| Virual Oral Presentation Slide by Slide |
|
IEEE/ICACT20230036 Slide.08
[Big Slide]
[YouTube] |
Oral Presentation |
|
|
|
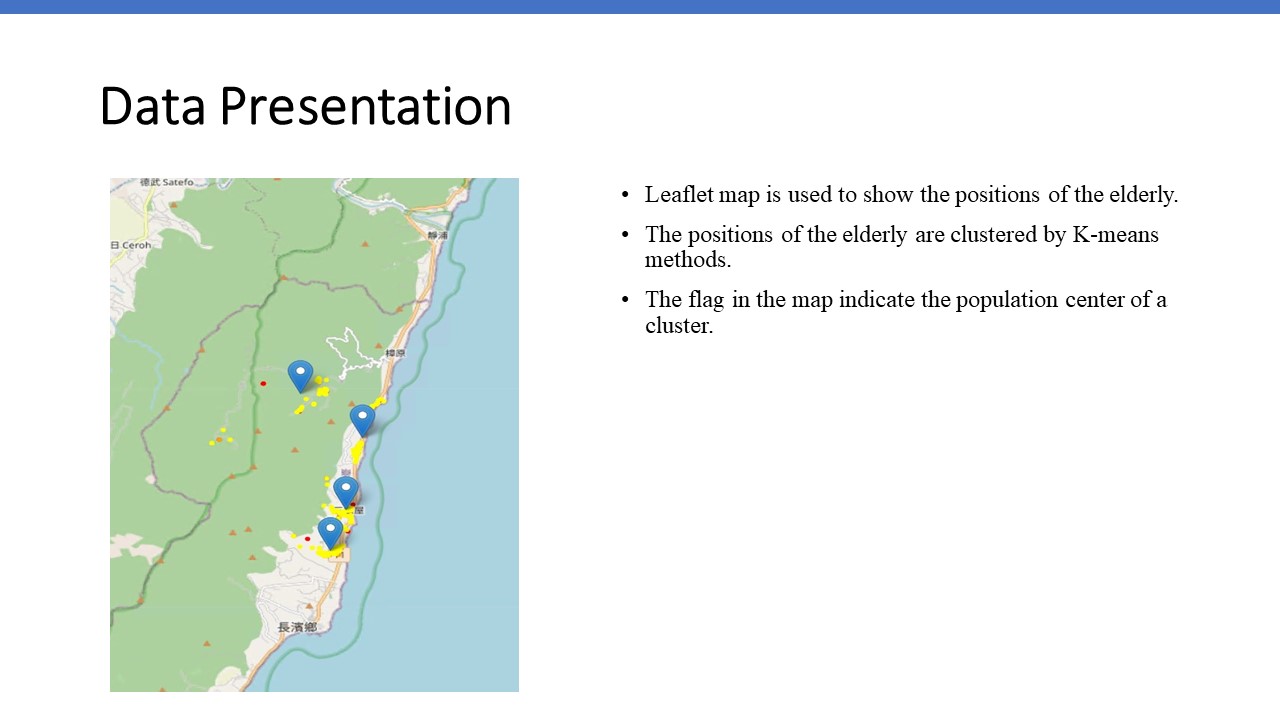
We use a leaflet map to mark the location of the elderly. After the locations of these elderly are clustered by k-means, the center point of the cluster is marked on the map in the form of a flag. | |
| [Go to Next Slide] |