 |
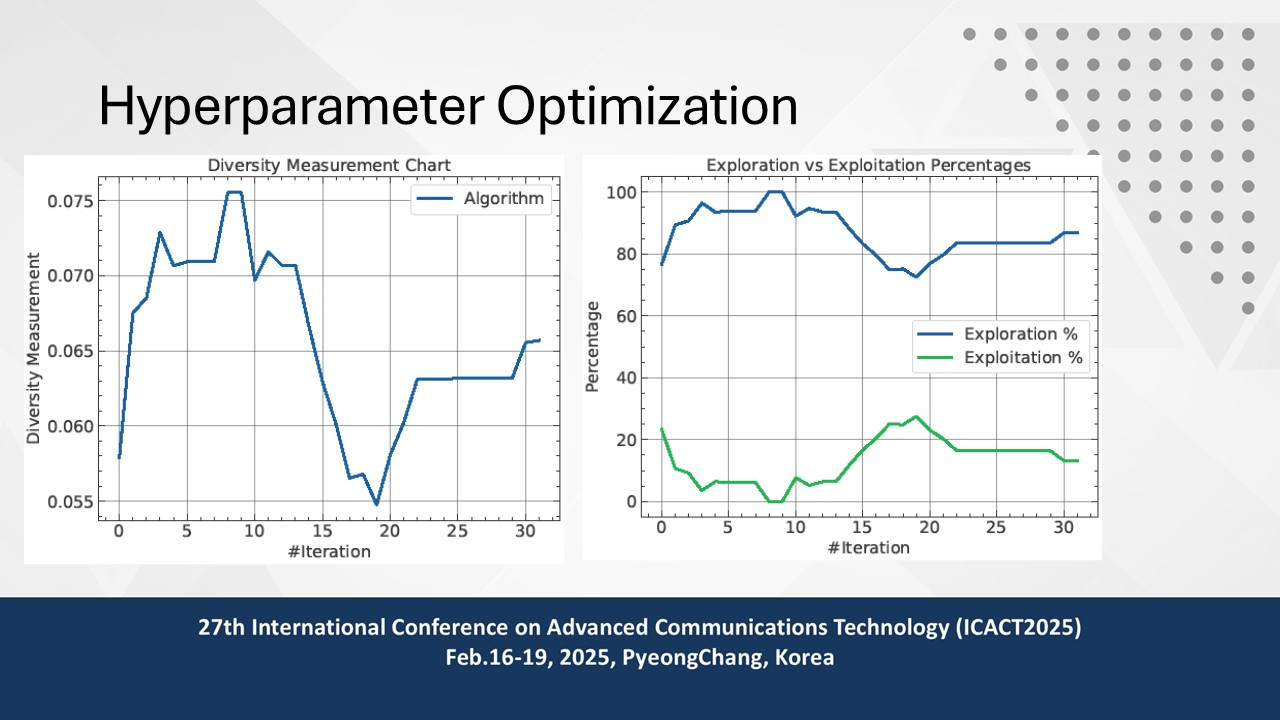
Diversity Measurement Chart Tracking the variety of solutions over iterations, the diversity measurement chart offers understanding of the search space exploration. The variety is first more reflective of the exploratory phase of the algorithm. Diversity reduces as AO advances, suggesting a concentration on exploitation; AO then narrows down on likely areas of the solution space to hone the ideal parameters.
\Percentage of Exploration vs. Exploitation chart shows how to strike the balance between exploitation and discovery. AO gives exploration top priority early in the optimization process in order to cover a large spectrum of feasible solutions. As the algorithm converges, the focus moves to exploitation, guaranteeing that the best solutions are polished further for highest accuracy in hyperparameter choice.
|
 IEEE/ICACT20250142 Slide.08
[Big Slide]