 |
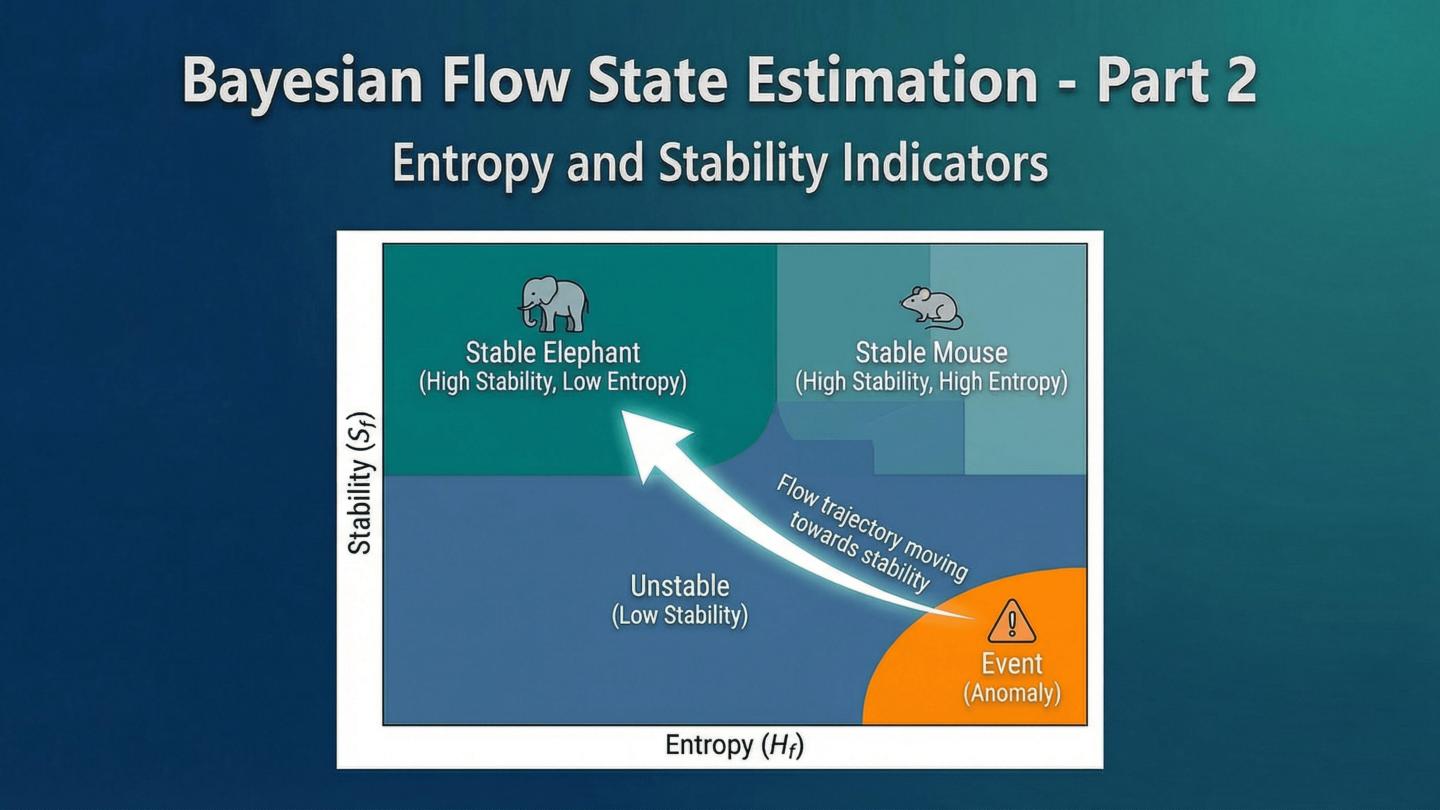
Lets look at how we translate the Bayesian posterior into concrete metrics that drive our monitoring decisions. From the Gaussian posterior, we derive two crucial uncertainty indicators: differential entropy and stability score. The differential entropy, H sub f, is a direct measure of how spread out our posterior distribution is. Higher entropy means greater uncertainty in the flow rate estimate, signaling that we need to probe that flow more frequently. This is a fundamental, information-theoretic measure of uncertainty. The second metric is the stability score, S sub f. This score quantifies the volatility of the flow rate itself, based on the sample variance of recent observations. A flow with a high stability score is highly unstable, meaning its rate is fluctuating rapidly. This is important because even if we have a low-entropy estimate right now, a highly unstable flow is likely to change soon. Using these two indicators, we automatically classify flows into four categories: stable elephants, stable mice, unstable flows, and event flows. This uncertainty-aware classification is the key to BRIGHTs efficiency, allowing us to concentrate our limited monitoring budget exactly where its needed most. This classification then feeds directly into our policy learning framework.
|
 IEEE/ICACT20260358 Slide.08
[Big Slide]
[YouTube]