 |
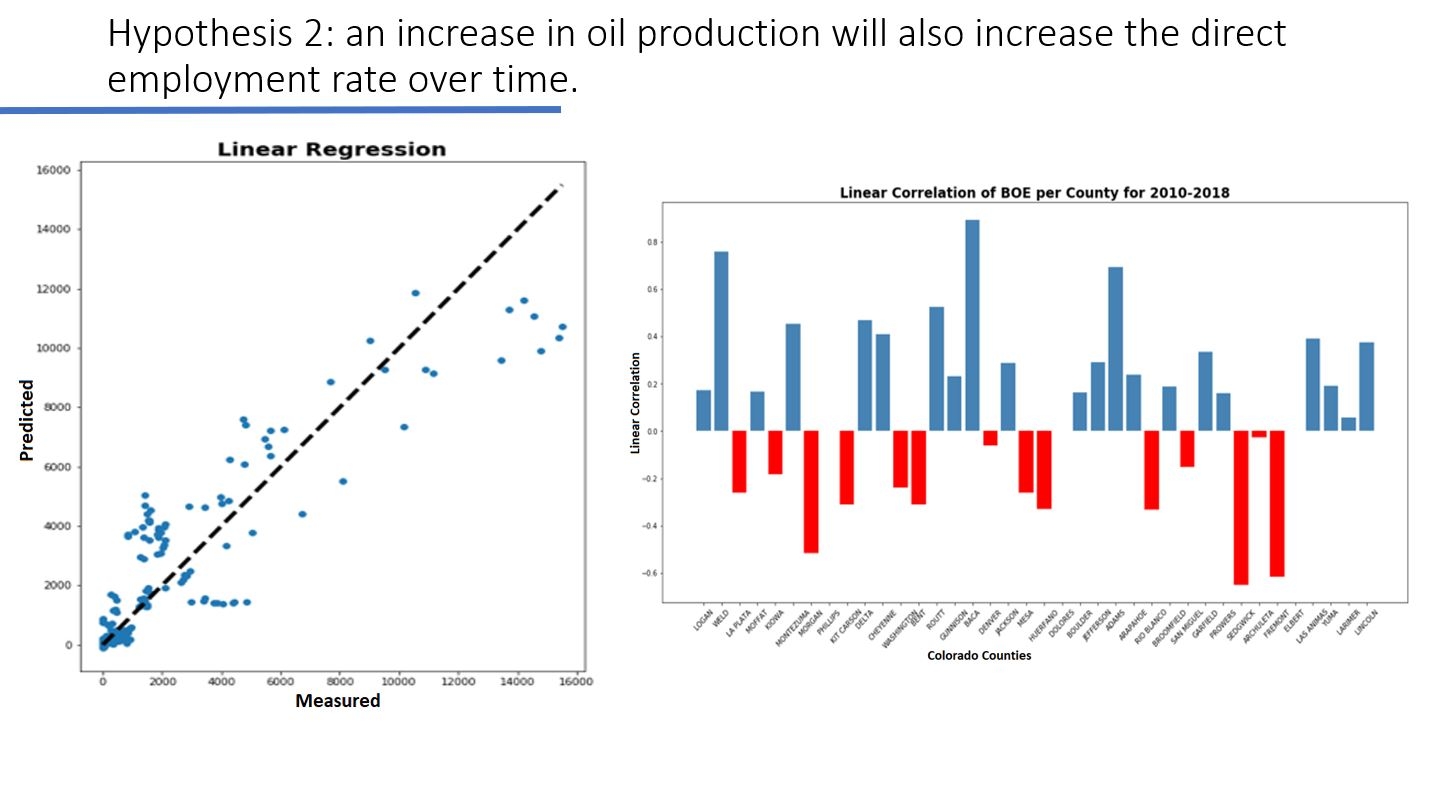
The figure on the left shows Linear Regression Result with direct employment as the response variable.
The figure on the right shows Pearson¡¯s¡¯ Linear Correlation of BOE with direct employment for all Counties throughout 2010-2018. The x-axis labels are Colorado county names, while the y-axis label is ¡°Linear Correlation.¡±
Through various analyses, we conclude that direct employment is correlated with hydrocarbon production, and the strength of the correlation is related to the production volume for the oil producing counties.
|
 IEEE/ICACT20210130 Slide.09
[Big Slide]