 |
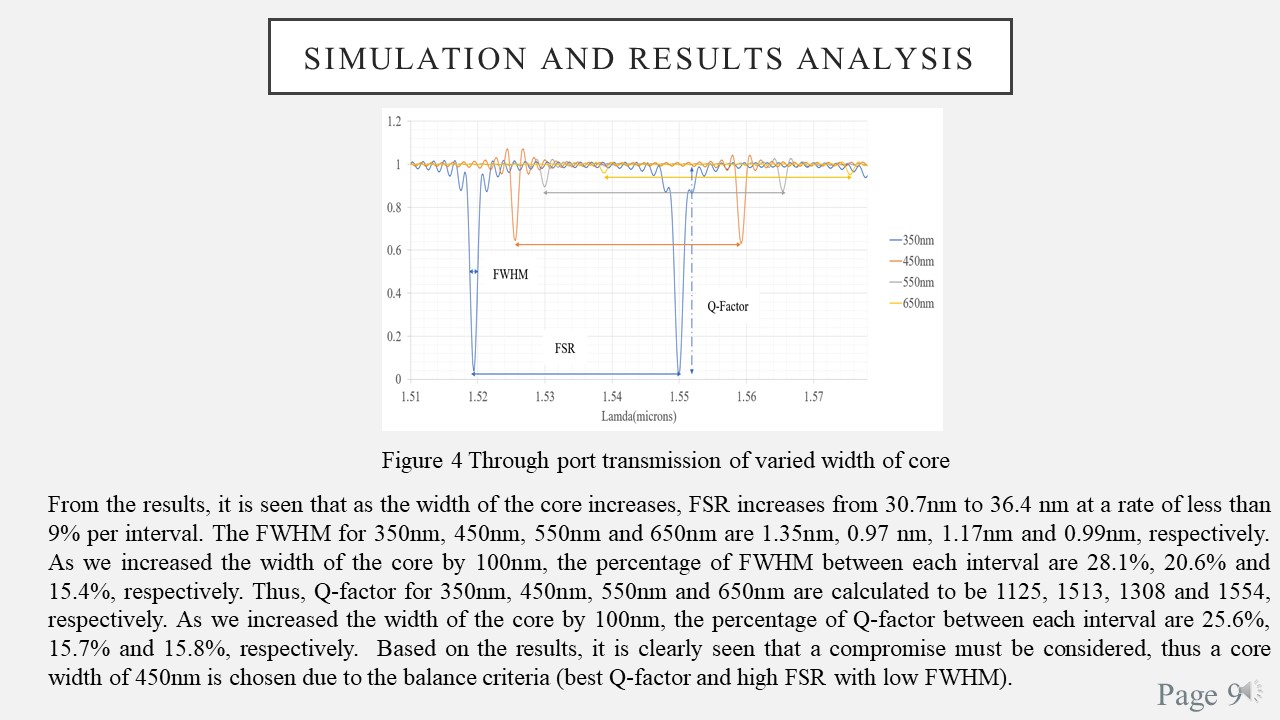
The proposed design from previous slide is simulated and the results obtained is shown in Figure 4.
Figure 4 shows the through port transmission of varied core width. From the results, it is seen that as we increased the core width, FSR increases from 30.7nm to 36.4 nm at a rate of less than 9% per interval.
The FWHM for 350nm, 450nm, 550nm and 650nm are 1.35nm, 0.97 nm, 1.17nm and 0.99nm, respectively.
As we increased the core width by 100nm, the percentage of FWHM between each interval are 28.1%, 20.6% and 15.4%, respectively. Thus, Q-factor for 350nm, 450nm, 550nm and 650nm are calculated to be 1125, 1513, 1308 and lastly 1554, respectively.
As we increased the core width by 100nm, the percentage of Q-factor between each interval are 25.6%, 15.7% and 15.8%, respectively. So, based on the results, it is clearly seen that a compromise must be considered, thus a core width of 450nm is chosen due to the balance criteria (best Q-factor and high FSR with low FWHM). |
 IEEE/ICACT20210139 Slide.09
[Big Slide]