 |
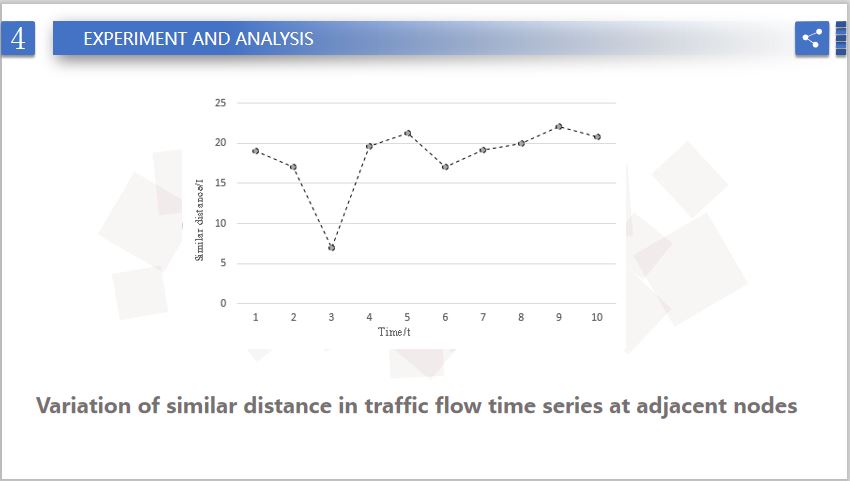
For each length moved by the sliding window, the similarity distance of traffic- flow time series at adjacent nodes is calculated, and the average arrival time of traffic flow is found through the minimum similarity distance. The experimental results of sliding window moving for 10 times are shown in Figure 2. It can be seen from Figure 2 that, with the movement of the sliding window, the similar distance of the time series of the motorway traffic flow at the adjacent nodes is changing constantly, but there will be an obvious downward and upward trend within a period of time, and there is a minimum value. When the similarity distance is the minimum, the traffic flow time series of adjacent nodes on the motorway is the most similar, and then the corresponding time is the average arrival time of the motorway traffic flow.
|
 IEEE/ICACT20210155 Slide.09
[Big Slide]