 IEEE/ICACT20230066 Slide.09
[Big Slide]
[YouTube] Oral Presentation
| Virual Oral Presentation Slide by Slide |
|
IEEE/ICACT20230066 Slide.09
[Big Slide]
[YouTube] |
Oral Presentation |
|
|
|
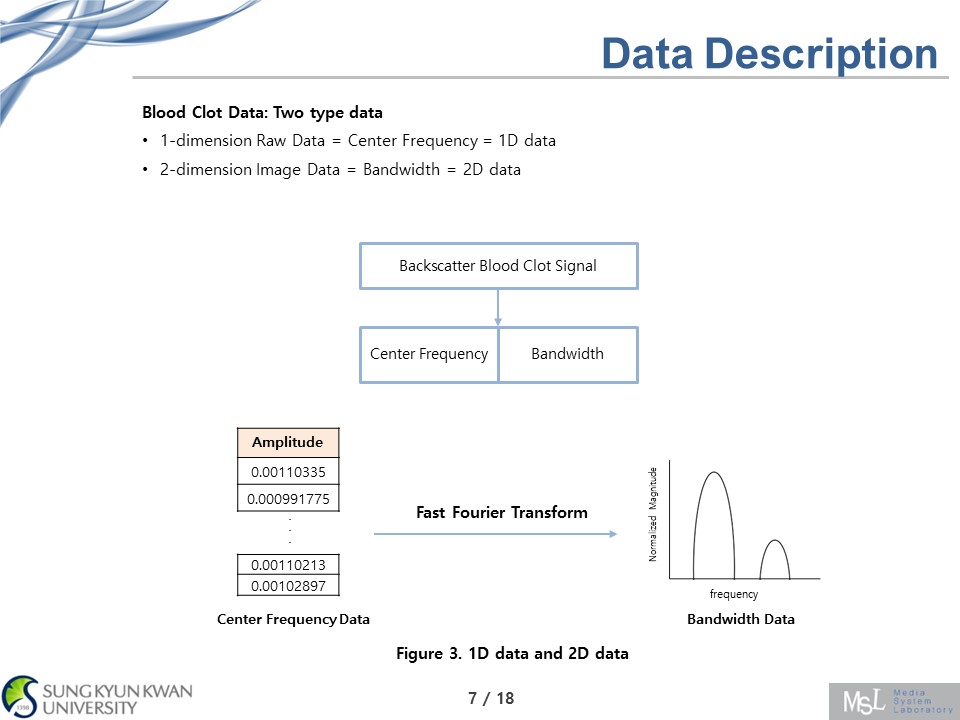
We can get this two type of data , so I'll call it a 1D and 2D in here, for convenience Band width and center frequency can be obtained from the blood clot backscatter signal, and 2D data is created by applying a Fourier transform to 1D data. Both are 1660 pieces of data, and each stage consists of 400 pieces of data | |
| [Go to Next Slide] |