 IEEE/ICACT20230158 Slide.09
[Big Slide]
[YouTube] Oral Presentation
| Virual Oral Presentation Slide by Slide |
|
IEEE/ICACT20230158 Slide.09
[Big Slide]
[YouTube] |
Oral Presentation |
|
|
|
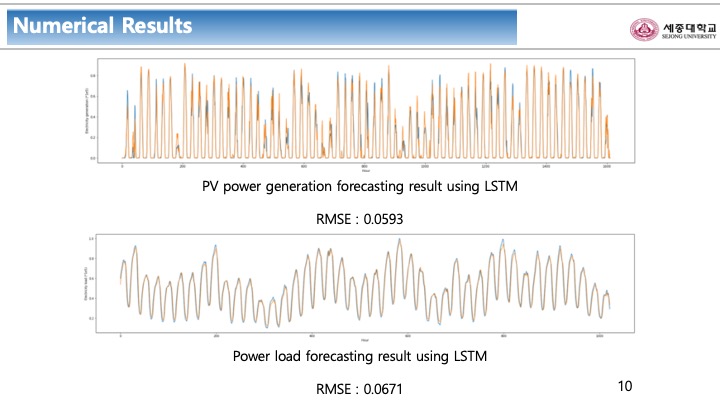
These figures are the results of two prediction models using LSTM. Root Mean Square Deviation(RMSE) was used as an evaluation index, and the RMSE value was low, indicating excellent performance. In the figure, the blue line represents the actual data and the orange line represents the predicted data, so you can see that most of the data matches. | |
| [Go to Next Slide] |