 |
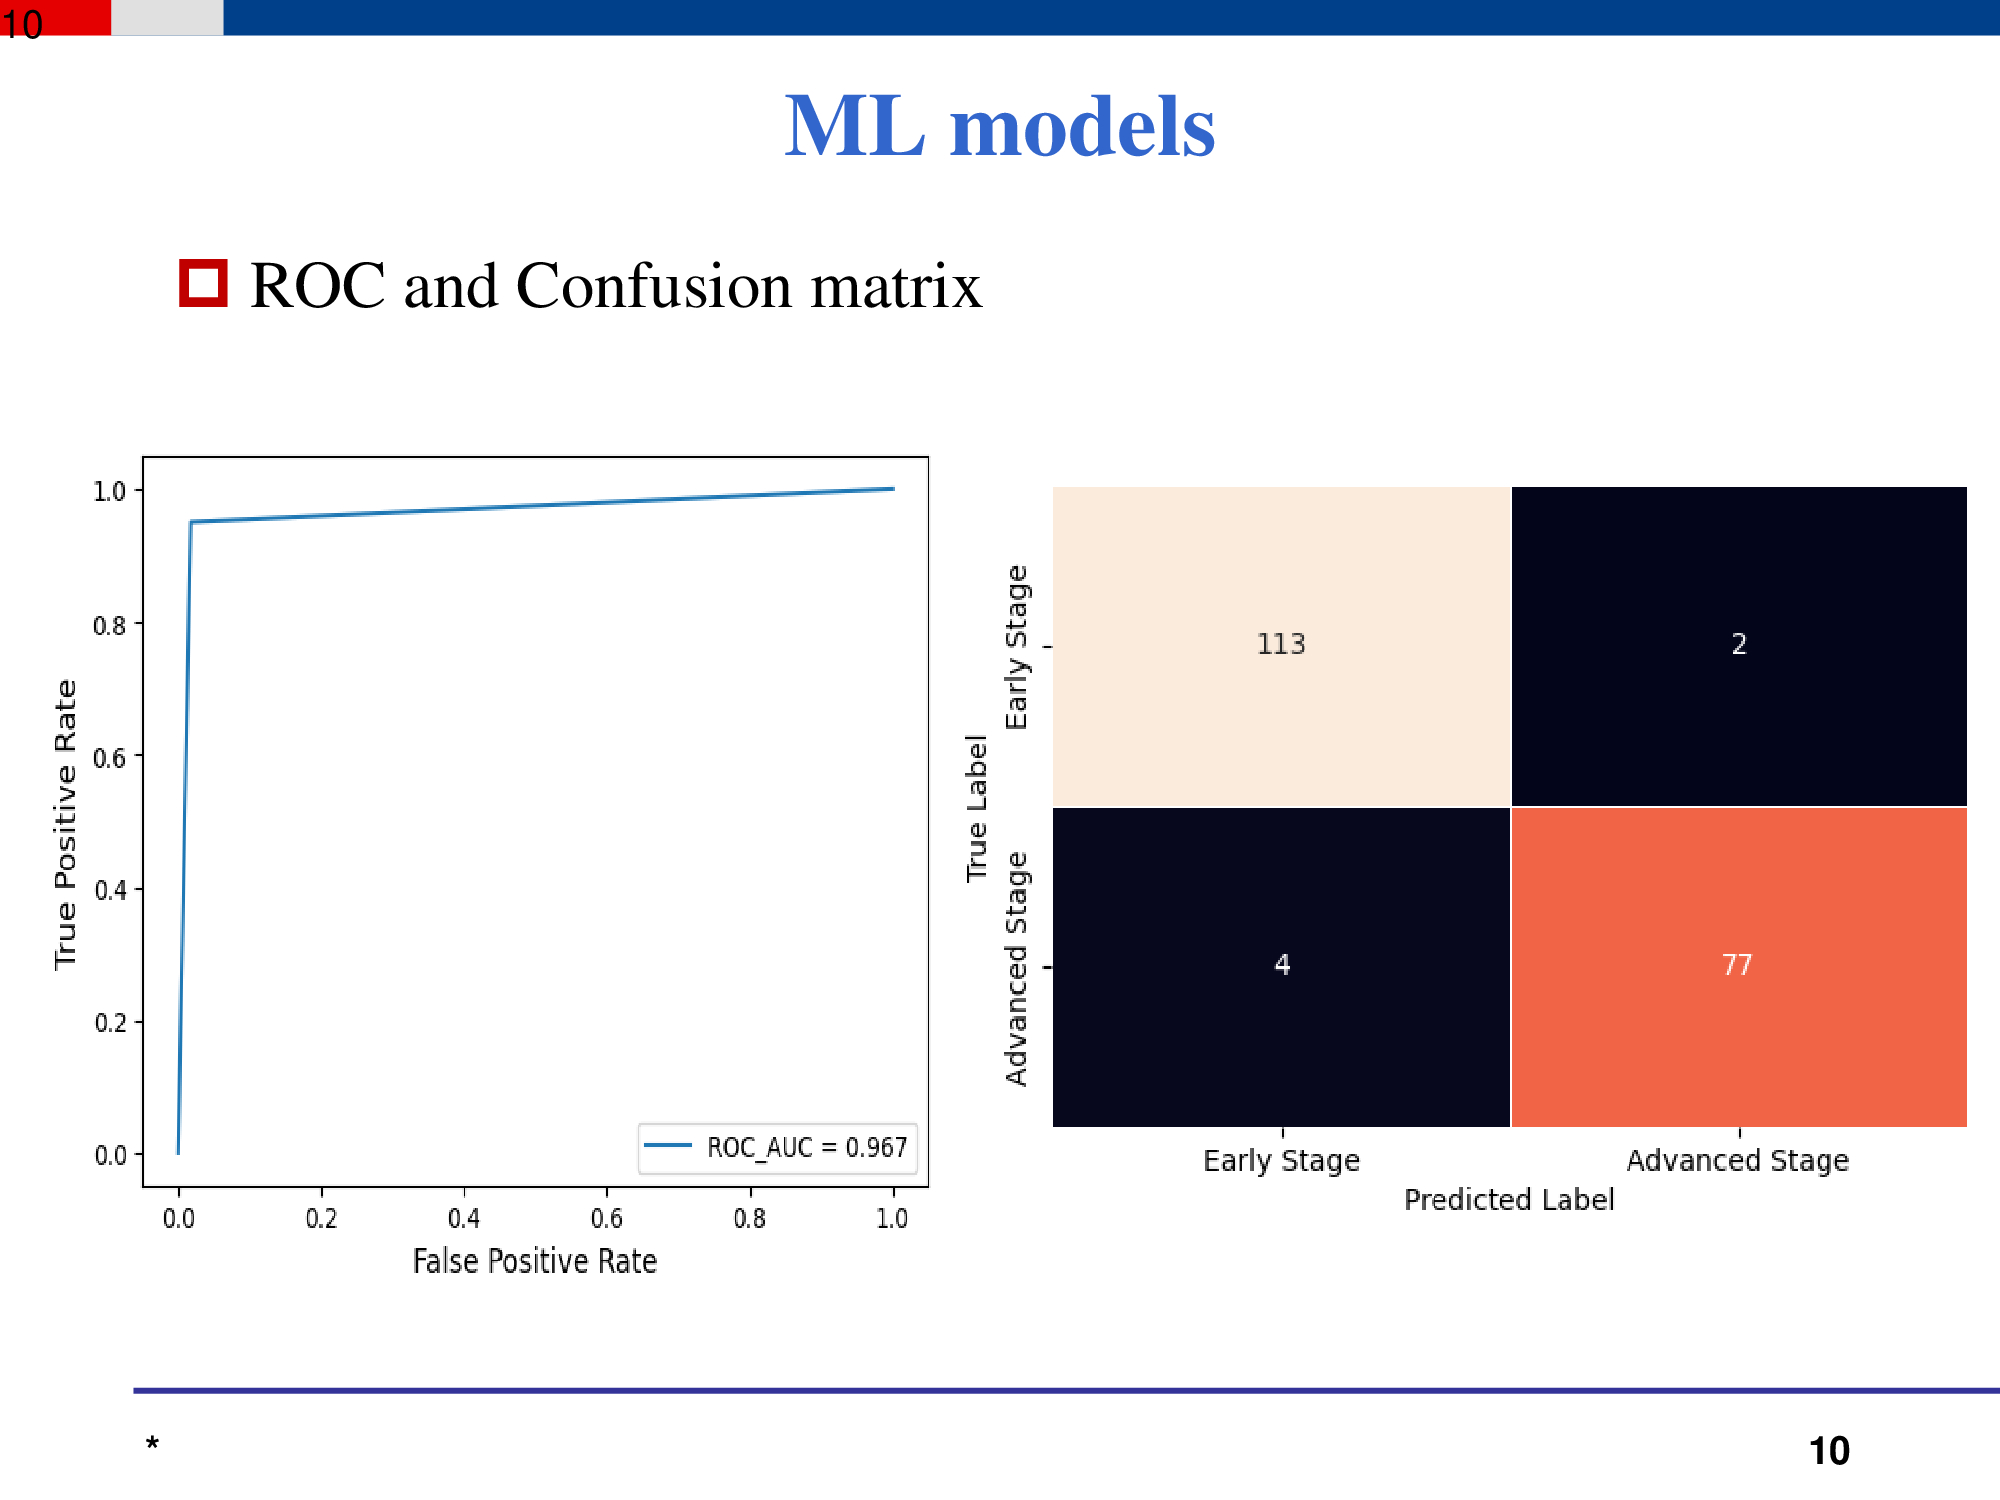
There are several metrics for the evaluation of the model.The figures show the ROC curve and confusion matrix. in the second figure the confusion matrix of our model shows the distribution of all the predicted responses to their true classes. Out of 196 test samples, 190 test samples as shown on the diagonal of the confusion matrix are correctly predicted and 6 samples are misclassified by the model. It means the model accuracy is quite encouraging for classifying the stages of gastric cancer carcinoma. |
 IEEE/ICACT20240402 Slide.09
[Big Slide]