 IEEE/ICACT20250064 Slide.09
[Big Slide]
Oral Presentation
| Virual Oral Presentation Slide by Slide |
|
IEEE/ICACT20250064 Slide.09
[Big Slide]
| Oral Presentation |
|
|
|
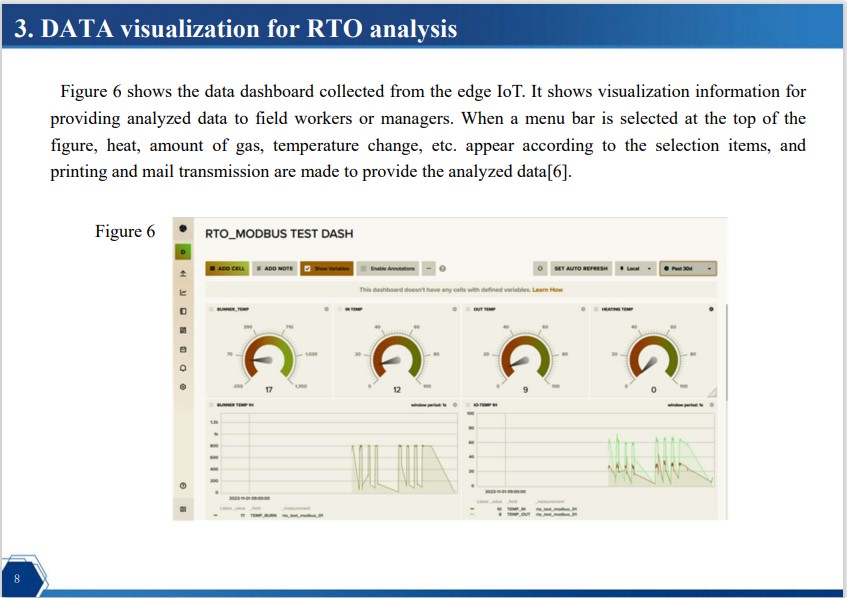
Figure 6 shows the data dashboard collected from the edge IoT. It shows visualization information for providing analyzed data to field workers or managers. When a menu bar is selected at the top of the figure, heat, amount of gas, temperature change, etc. appear according to the selection items, and printing and mail transmission are made to provide the analyzed data[6]. | |
| [Go to Next Slide] |