 |
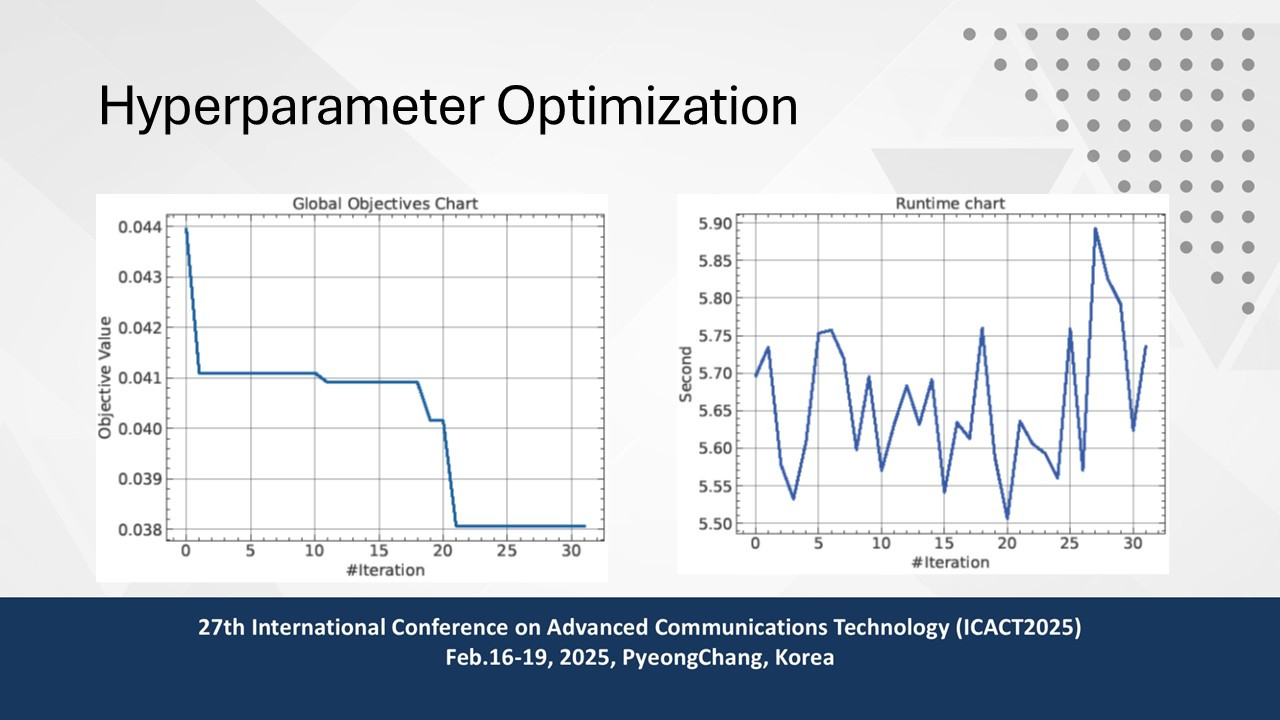
Global Objectives Chart Across iterations, this chart shows the objective function values. The declining trend shows AO's achievement in reducing the objective function, thereby obtaining ever better hyperparameter values. The stabilization at the end indicates that AO has most likely attained ideal or almost ideal conditions for the deep learning model.\end{itemize}
The runtime chart displaying in seconds the time taken for every iteration of AO. The differences in runtime show the computing load AO needs to investigate and use various hyperparameter settings. The runtime stays rather constant, with small variations as the method tries to optimally balance stages of exploration and exploitation.
|
 IEEE/ICACT20250142 Slide.09
[Big Slide]