 IEEE/ICACT20210161 Slide.10
[Big Slide]
Oral Presentation
| Virual Oral Presentation Slide by Slide |
|
IEEE/ICACT20210161 Slide.10
[Big Slide]
| Oral Presentation |
|
|
|
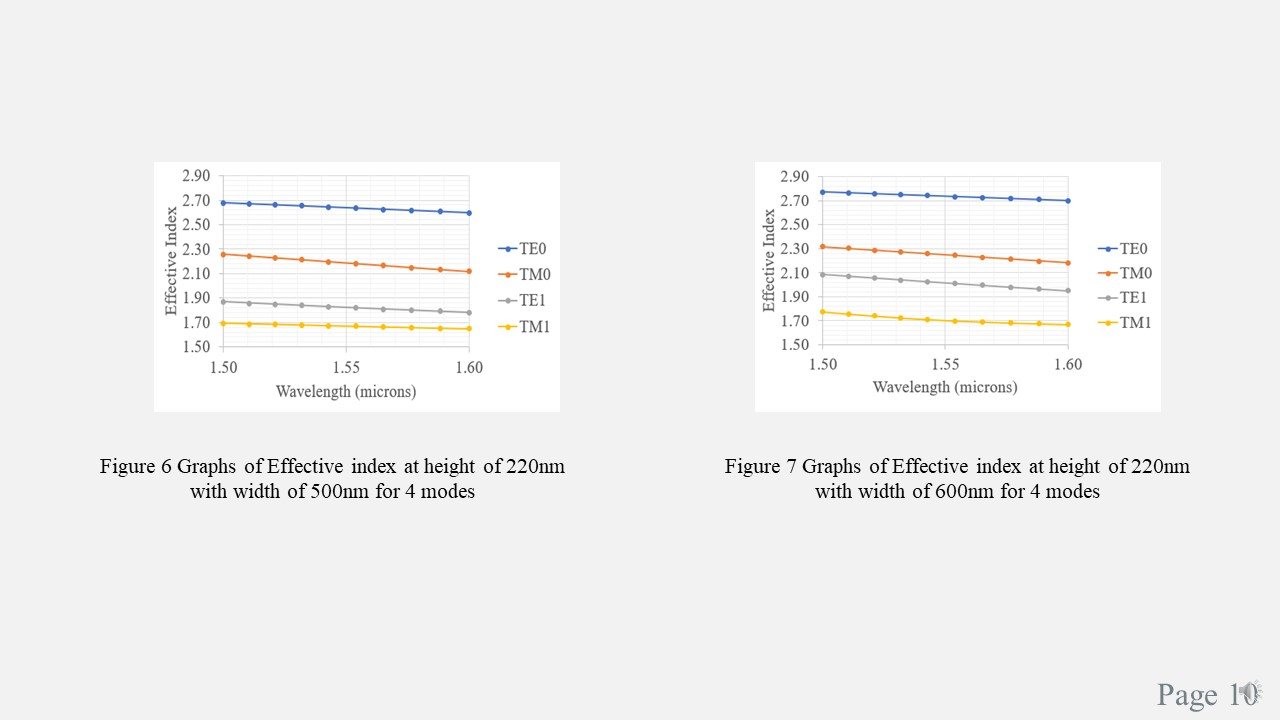
Figure 6 shows the graphs of effective index at height of 220nm with width of 500nm whereas for Figure 7 , it is for width of 600nm. From both Figure, it is shown that as we increased the core width, effective index also increases. | |
| [Go to Next Slide] |