 IEEE/ICACT20230066 Slide.10
[Big Slide]
[YouTube] Oral Presentation
| Virual Oral Presentation Slide by Slide |
|
IEEE/ICACT20230066 Slide.10
[Big Slide]
[YouTube] |
Oral Presentation |
|
|
|
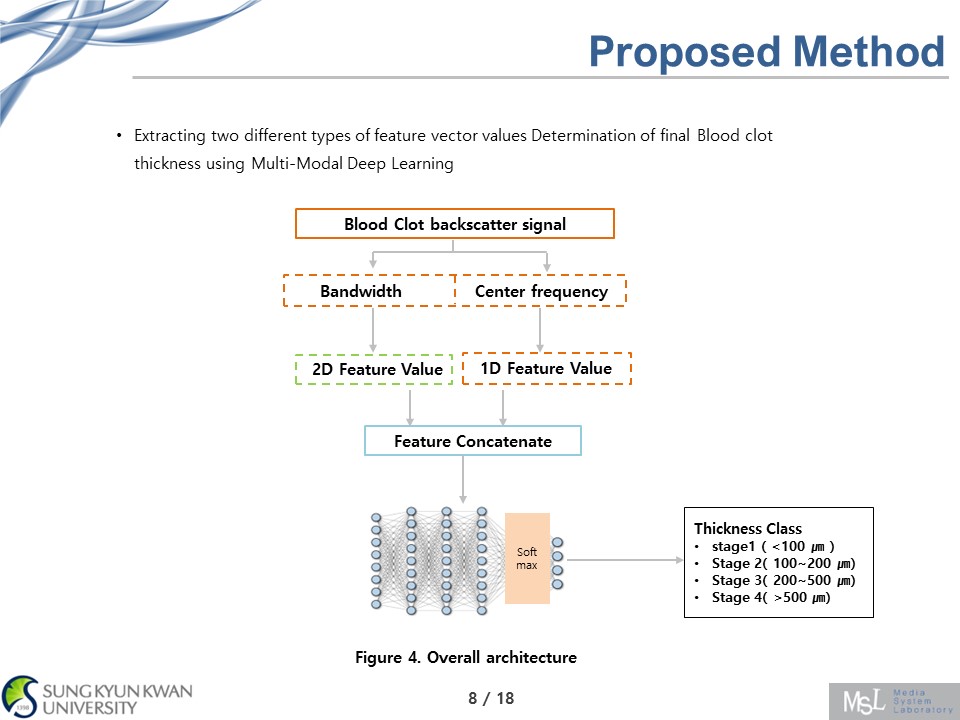
The overall structure is here. First, the 1D feature vector value is extracted using the Center Frequency information of the blood clot backscatter signal. Also, from image data , 2D feature vector is extracted And then, two type of feature vector go through the feature concatenation process. thickness value of the Blood clot can be inferred through multimodal learning from two types of feature vectors. | |
| [Go to Next Slide] |