 IEEE/ICACT20230158 Slide.10
[Big Slide]
[YouTube] Oral Presentation
| Virual Oral Presentation Slide by Slide |
|
IEEE/ICACT20230158 Slide.10
[Big Slide]
[YouTube] |
Oral Presentation |
|
|
|
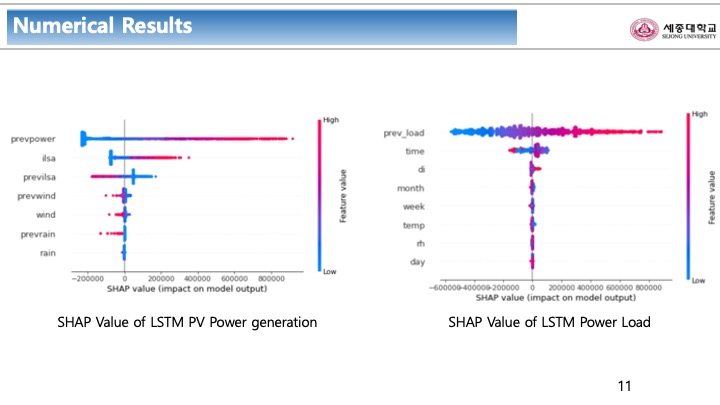
These plots show how much each variable has affected the result value as a result of the DeepSHAP XAI algorithm. In both models, we can see that solar power and consumption in the previous time had the greatest impact. | |
| [Go to Next Slide] |