 |
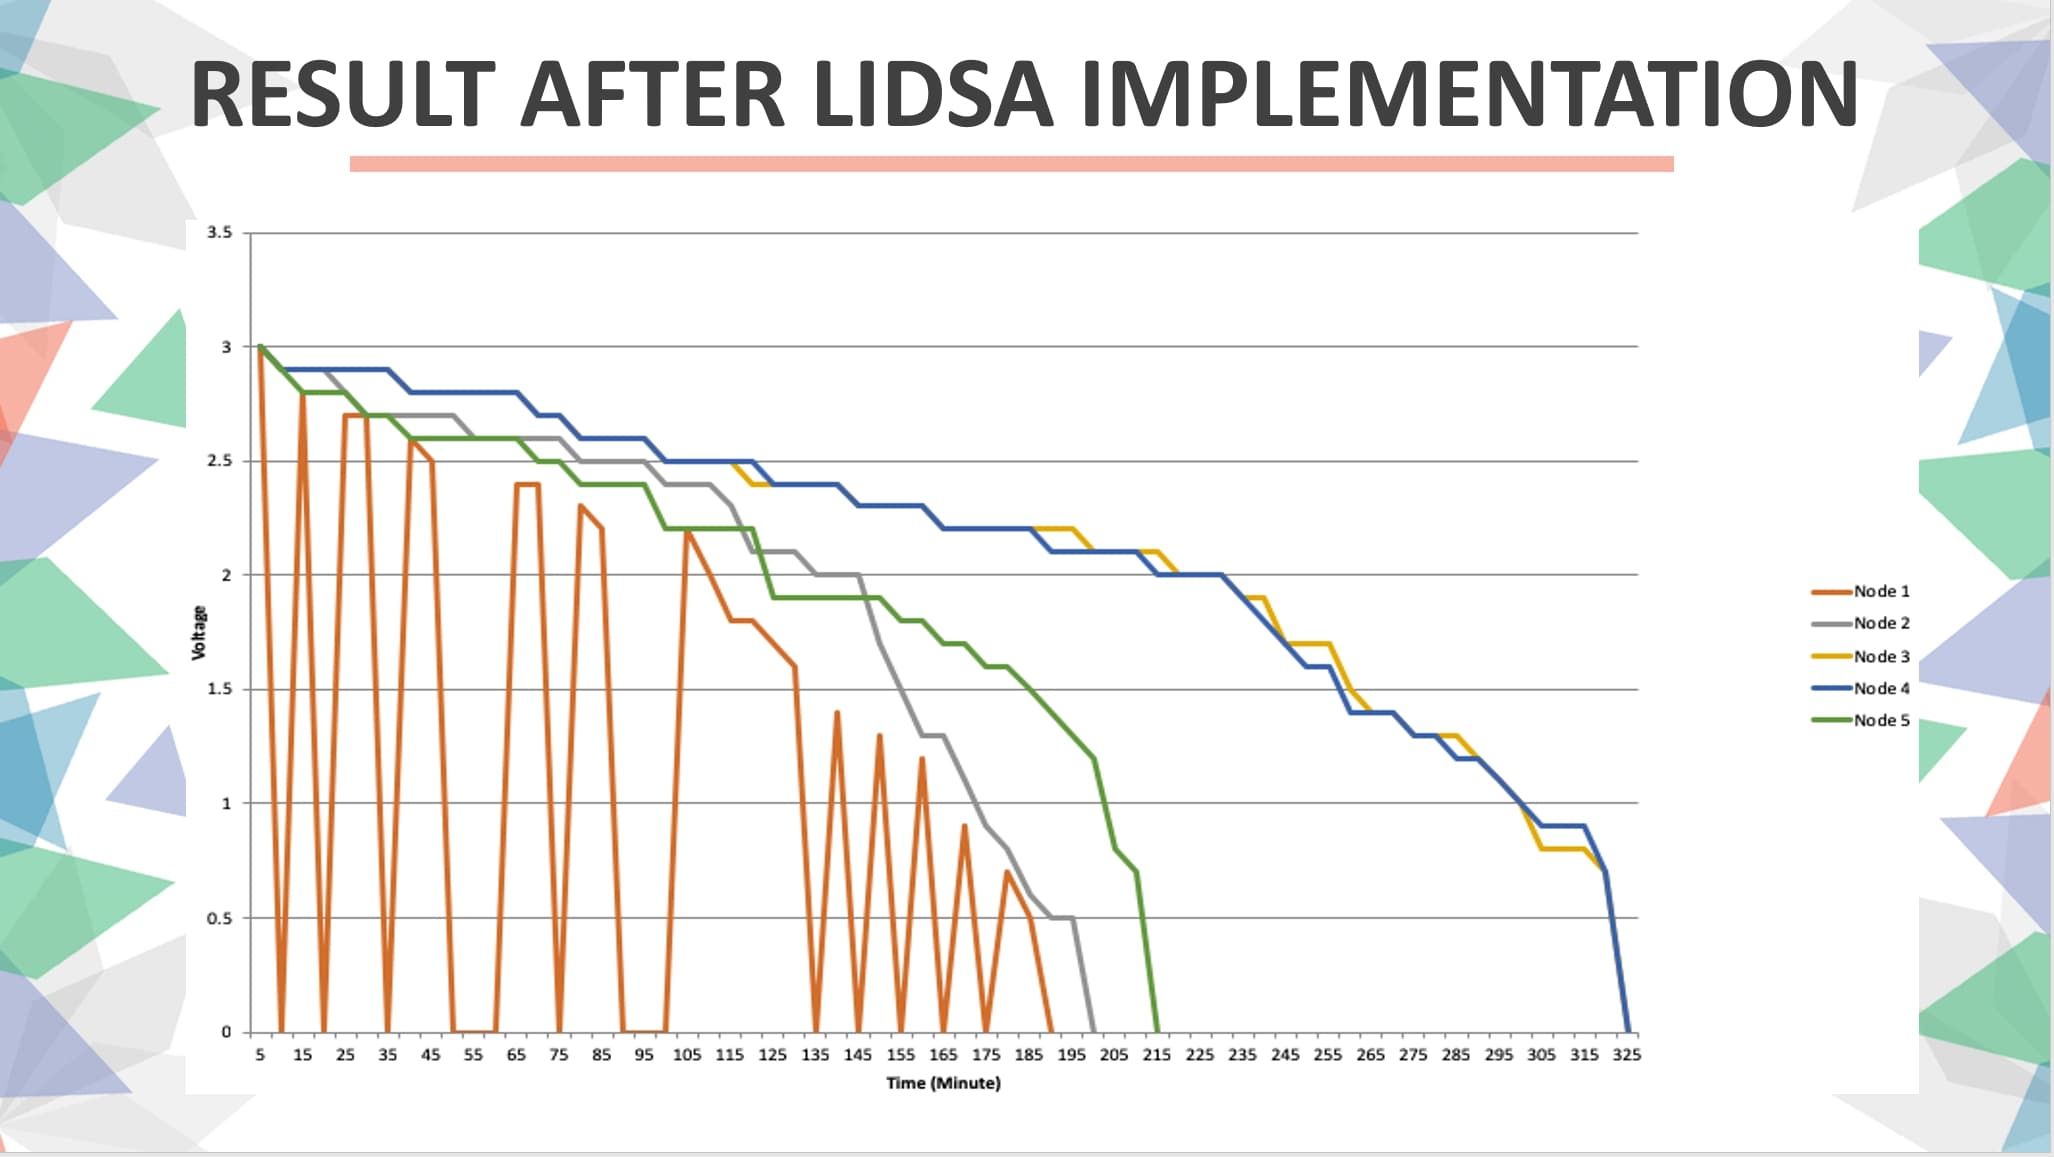
The graph shows an irregular pattern. Once the DoS attack launched, the Sensor Node 1 voltage reading has a sharp, sudden drop off to zero voltage at tenth minutes.
Five minutes after that, the node operated and sent data to Cloud with a voltage a little bit lower than 3V before it was disabled again. The pattern was repeated until the note was
completely shut off after 190 minutes. The longest time it was able to operate without being interrupted is during minute 105 until 135 (30 minutes).
However, due to the DoS attack, the voltage has decreased to 2.8V. The DoS attack occurred again in minute-20, causing the node to be temporarily defective. The situation met the
algorithm's first condition, so the packet was dropped, and Sensor Node 1 switched to another wireless network. The pattern was repeated whenever the conditions of the algorithm
matched. If the conditions do not match, the packets will be transmitted as usual, which means the IoT Sensor Node will be able to send data to the cloud without interruption. If that
is the case, the graph line will be one with slow and steady voltage drops. However, despite the irregular pattern, the figure proves that Sensor Node 1 can send data to Cloud
during the DoS attack and with an improved lifespan with the implementation of the proposed algorithm.
|
 IEEE/ICACT20210221 Slide.11
[Big Slide]