 IEEE/ICACT20220197 Slide.11
[Big Slide]
[YouTube] Oral Presentation
IEEE/ICACT20220197 Slide.11
[Big Slide]
[YouTube] Oral Presentation 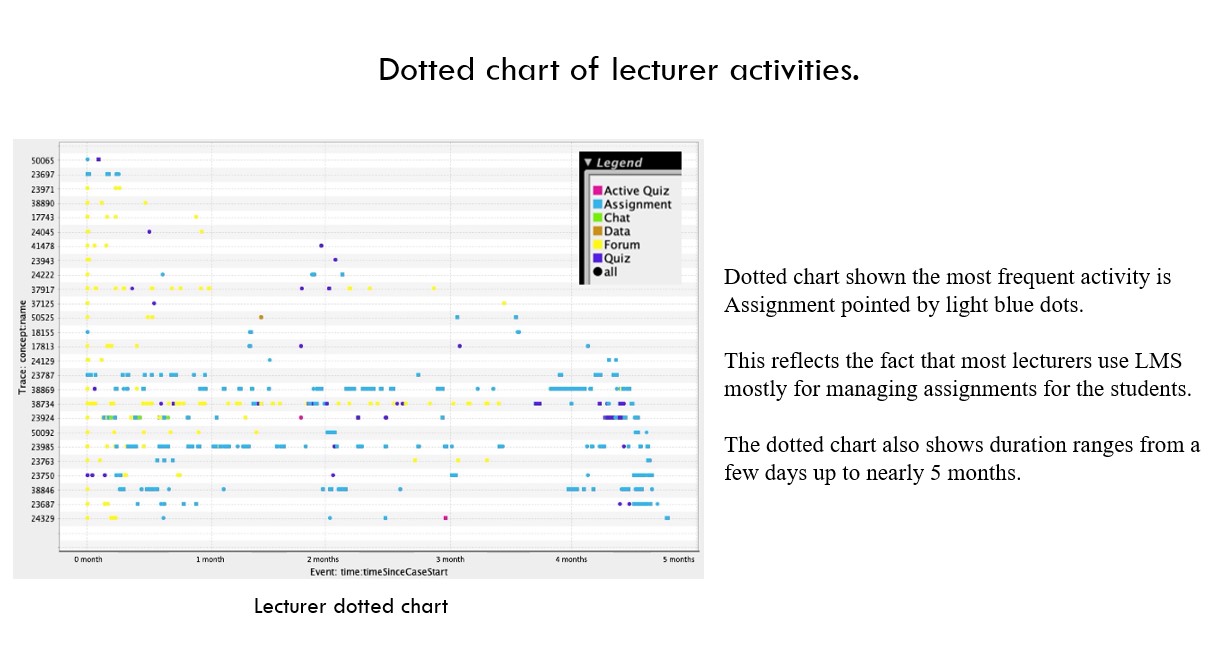
| Virual Oral Presentation Slide by Slide |
|
IEEE/ICACT20220197 Slide.11
[Big Slide]
[YouTube] |
Oral Presentation |
|
|
|
More detailed analysis for the lecturer data log also can be done by examining the dotted chart. Dotted chart shown the most frequent activity is Assignment pointed by light blue dots. This reflects the fact that most lecturers use LMS mostly for managing assignments for the students. The dotted chart also shows duration ranges from a few days up to nearly 5 months. This reflects the real situation where some lecturers have used LMS much more that the other lecturers. | |
| [Go to Next Slide] |