 |
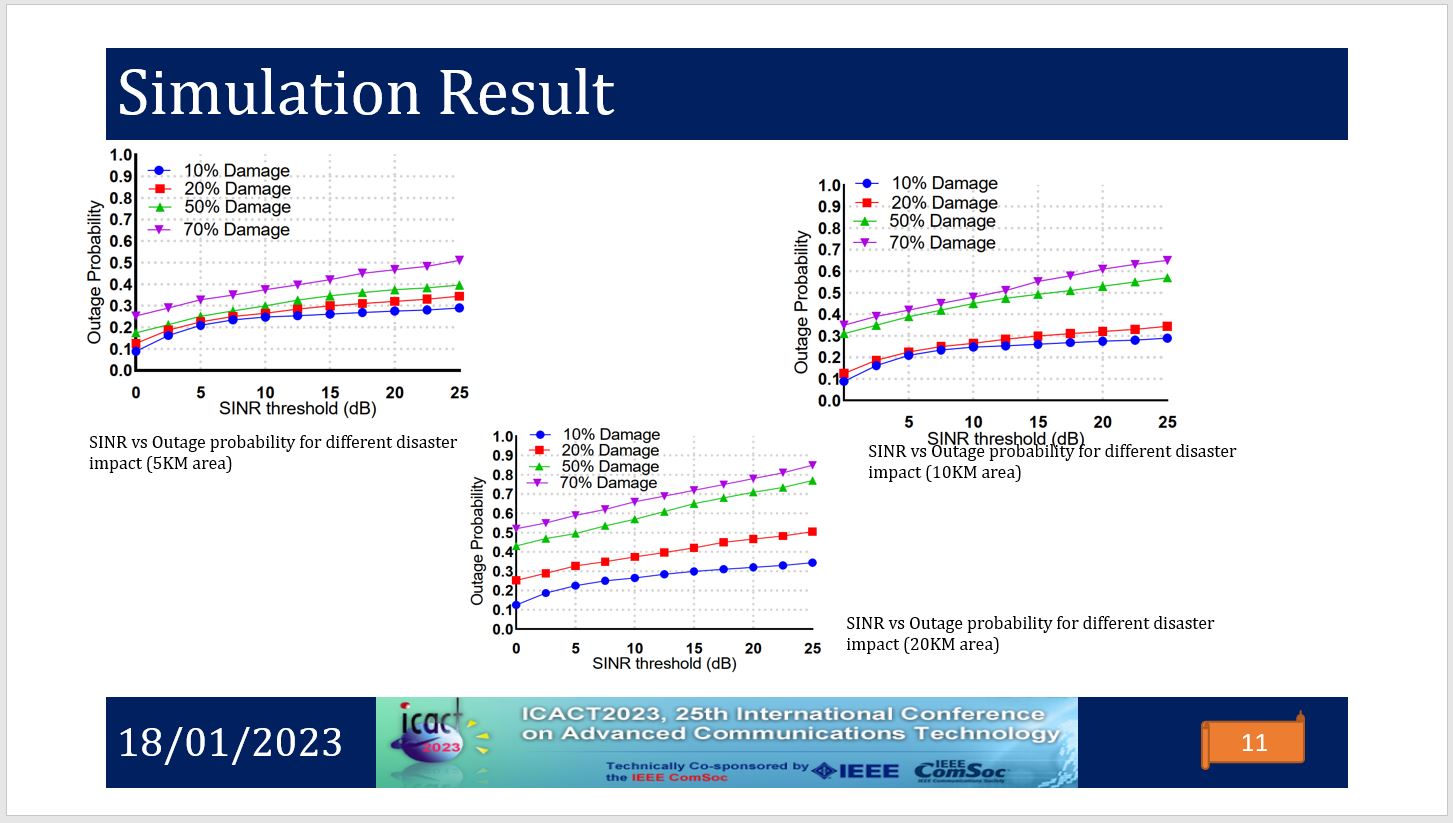
This figure shows the simulation result. The top left figure shows the outage probability vs SINR in 5KM wrt different scales of disaster impact. Top right shows for 10 km area and the bottom shows for 20 km area. considering the 5 km area there is not much impact up to 50 % damage. However, when it is a big disaster impact 50% damage in 20 KM means only 10 BS are in working condition. Only 20 % of users will get the best quality of service for communication. The details results are described in the paper. |
 IEEE/ICACT20230194 Slide.11
[Big Slide]