 |
OK, then, let¡¯s take a look at the antenna patterns.
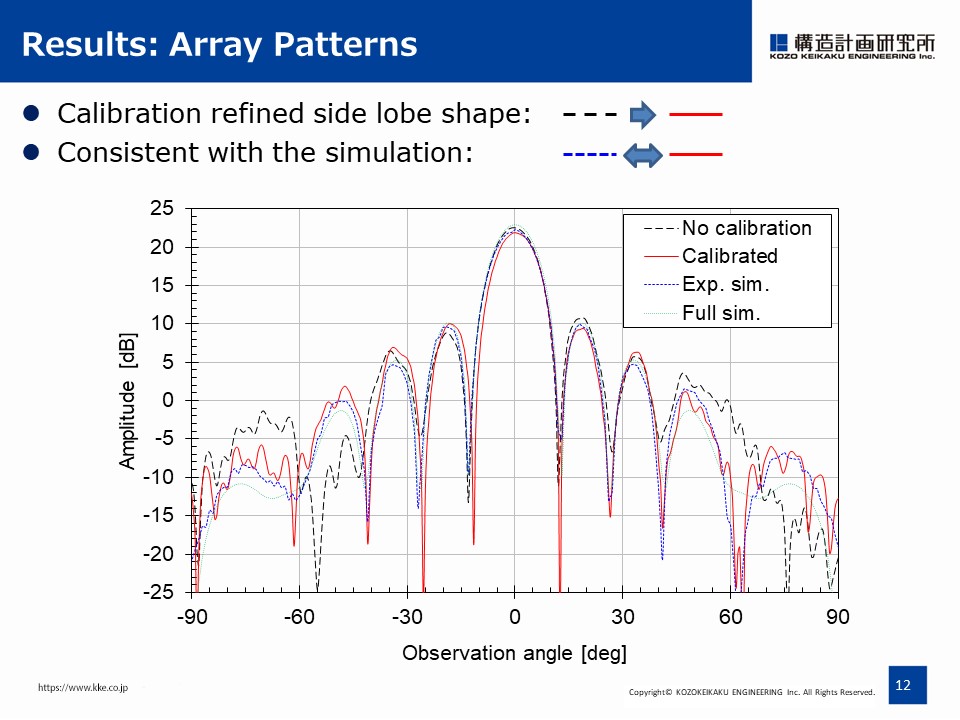
Four different array patterns are compared.
The black dashed line is the array pattern with no calibration.
The red solid line represents the pattern with MEP calibration.
The blue dotted line indicates simulation pattern calculated by combining all the experimental element patterns with no phase or gain errors.
The green small dotted line is the electromagnetic simulation result.
These results show that the calibration refined the sidelobe structure and it is consistent with the blue line of simulation result assuming the ideal case.
|
 IEEE/ICACT20210172 Slide.12
[Big Slide]