 |
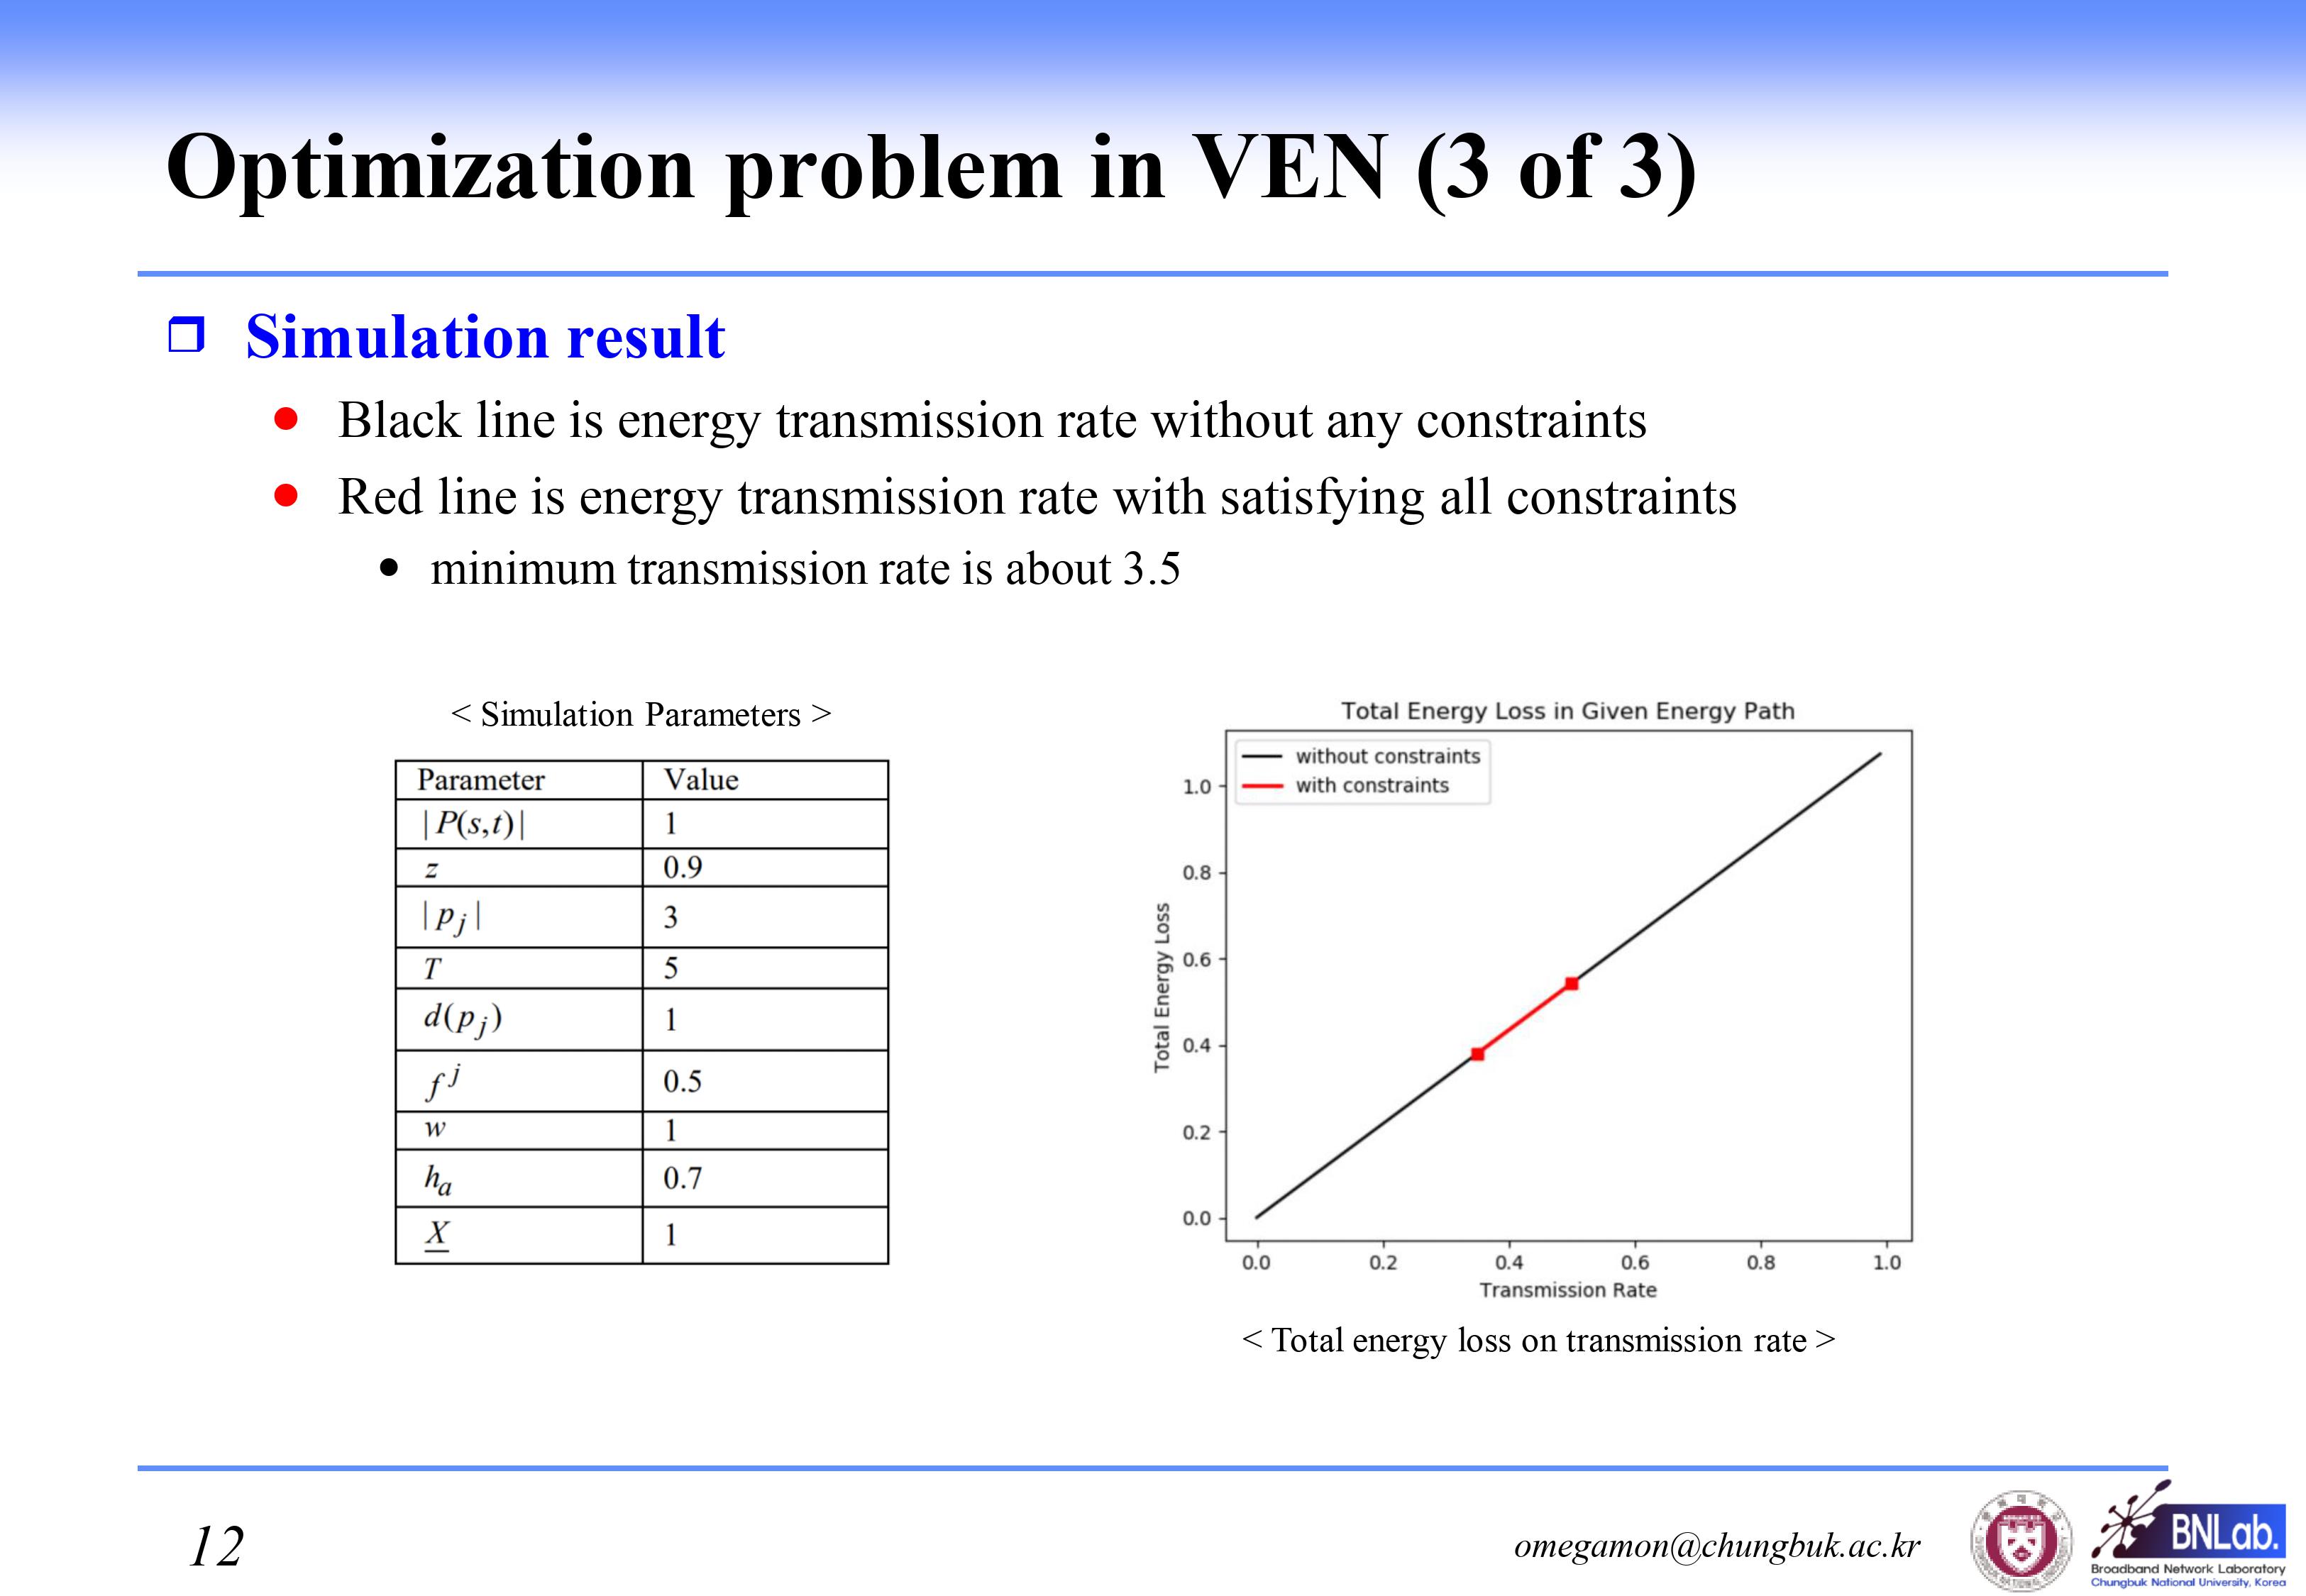
We simulate optimization problem that described in equation (3). The parameter values, which are used in simulation, are listed in table.
The figure shows relation between transmission rate and total energy loss in given energy path.
Because total energy loss is determined by transmission rate in given energy path condition, a linear graph is gotten.
Black line is energy transmission rate without any constraints. In the black line, segment of a line bounded by red squares is transmission rates, which are satisfy all constraints. With all constraints, minimum transmission rate is about 3.5.
|
 IEEE/ICACT20210186 Slide.12
[Big Slide]