 |
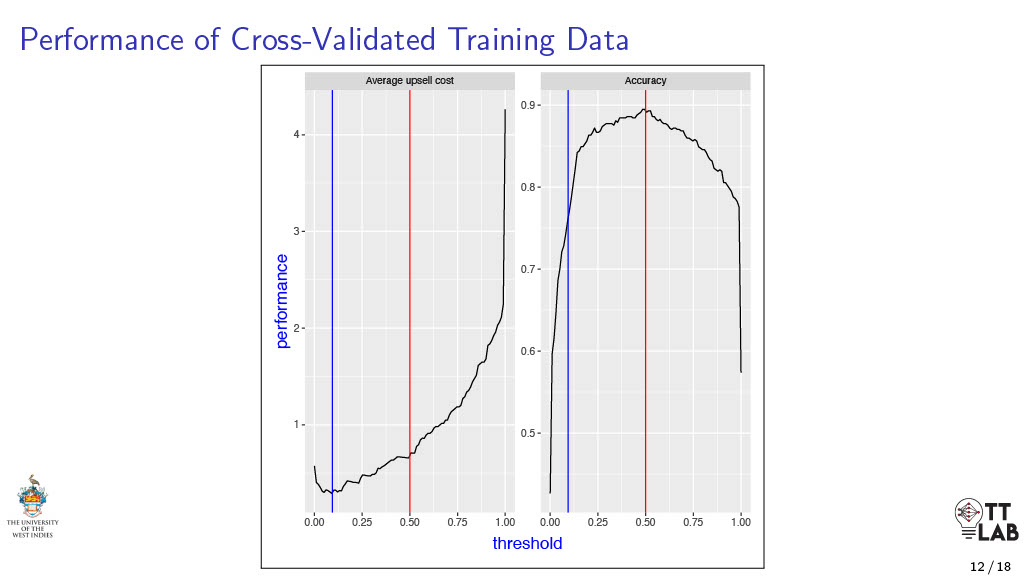
This figure shows the performance of Cross-Validated Training Data with Cost Optimal Threshold (blue) when ョ = 1 and Default Threshold (red) when ョ = 0.1. The trade-off between accuracy and cost when ョ = 0.1 and when ョ = 1 is clearly shown in this figure. For ョ = 0:1 the cost-optimal tuned threshold value was t =
0:0935 and the optimal expected cost was 0.2842. However,
there was a reduced accuracy of 76.3% when compared to the
accuracy if no costs are implemented (89.5%). In contrast, for
ョ = 1 costs are ignored and the threshold t selected optimizes
accuracy rather than cost where t = 0:5. The expected cost
for the accuracy-based optimal result was found to be much
higher with a value of 0.6737. |
 IEEE/ICACT20220017 Slide.12
[Big Slide]