 IEEE/ICACT20220302 Slide.12
[Big Slide]
Oral Presentation
| Virual Oral Presentation Slide by Slide |
|
IEEE/ICACT20220302 Slide.12
[Big Slide]
| Oral Presentation |
|
|
|
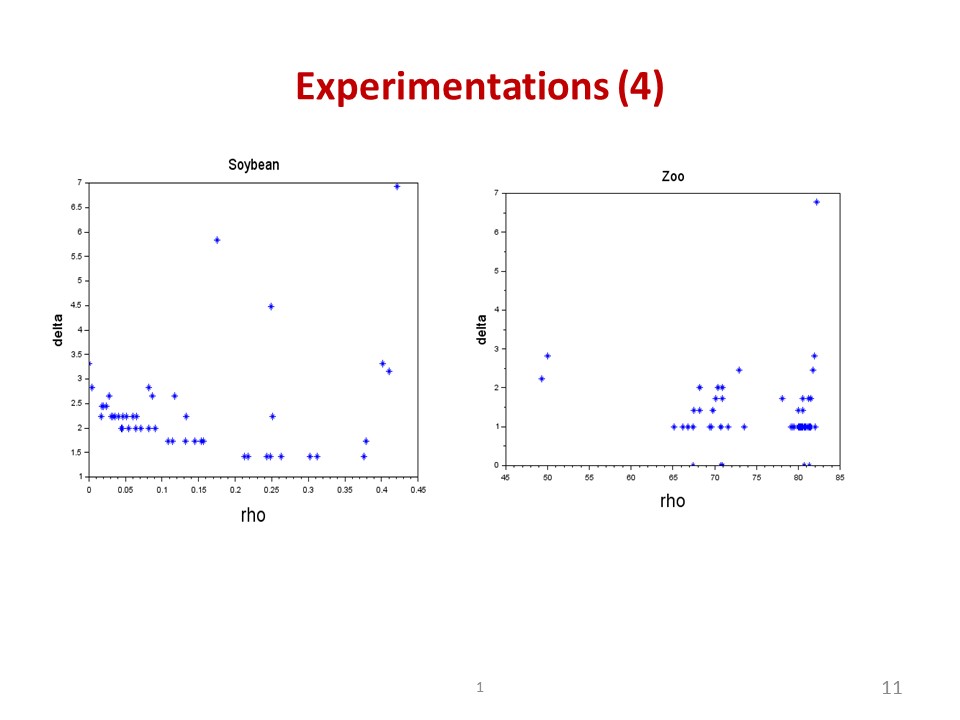
The Soybean dataset consists of 4 clusters. From its decision graph as shown in the left slide, it can be seen that if we determine 4 peaks at the top right position, there will be two points falling into the same cluster. Similar to Soybean, it is not easy to determine all 7 cluster centers in the Zoo dataset as illustrated in right of slide. | |
| [Go to Next Slide] |