 IEEE/ICACT20230194 Slide.12
[Big Slide]
Oral Presentation
| Virual Oral Presentation Slide by Slide |
|
IEEE/ICACT20230194 Slide.12
[Big Slide]
| Oral Presentation |
|
|
|
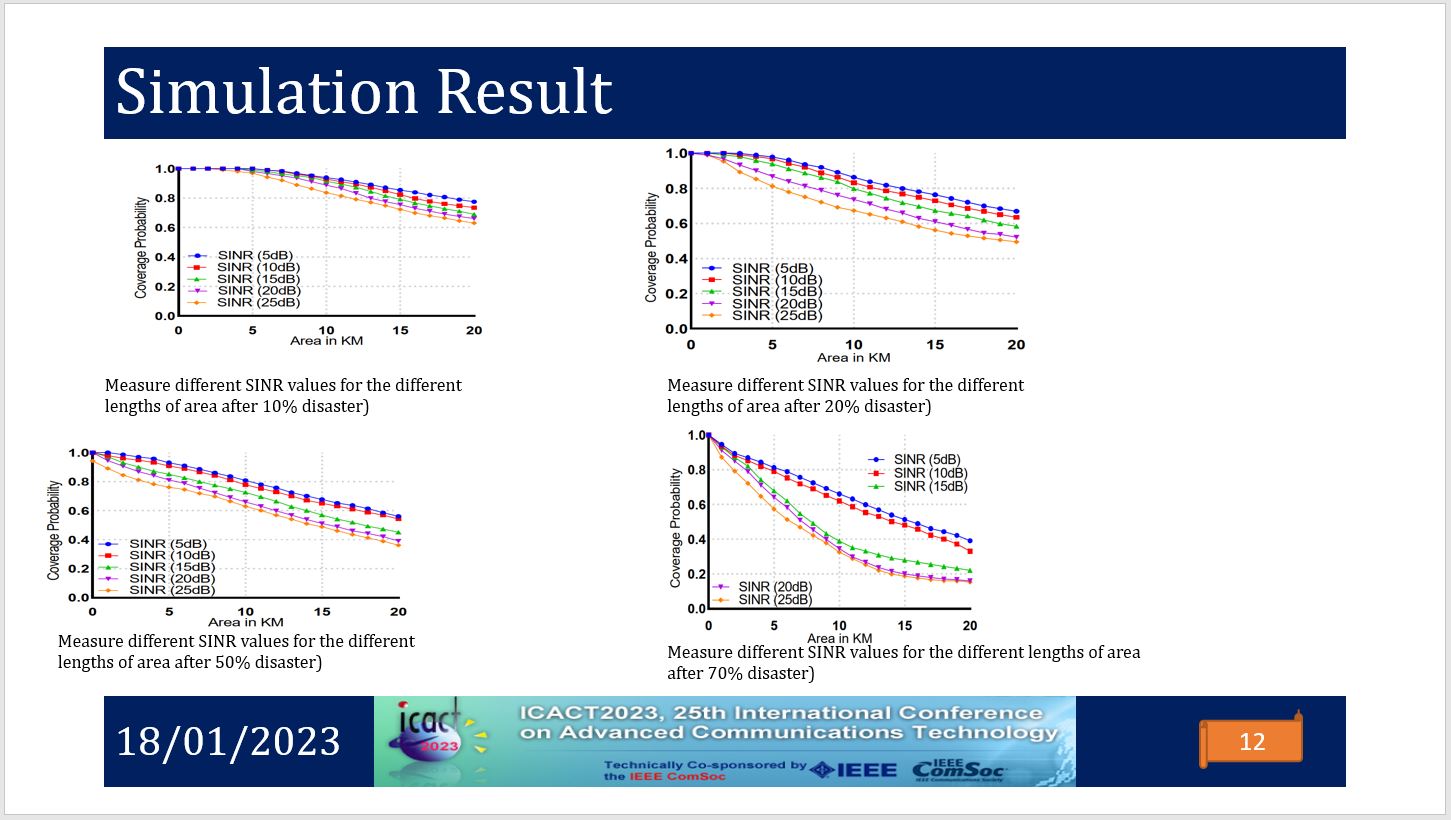
This slide shows the coverage probability in different kM wrt different scales of the disaster. For example, 70% disaster: blow 20% people get 25dB. However, on avg 60% of users can get 10dB SINR. For the details refers to the paper. | |
| [Go to Next Slide] |