 IEEE/ICACT20240067 Slide.12
[Big Slide]
[YouTube] Oral Presentation
| Virual Oral Presentation Slide by Slide |
|
IEEE/ICACT20240067 Slide.12
[Big Slide]
[YouTube] |
Oral Presentation |
|
|
|
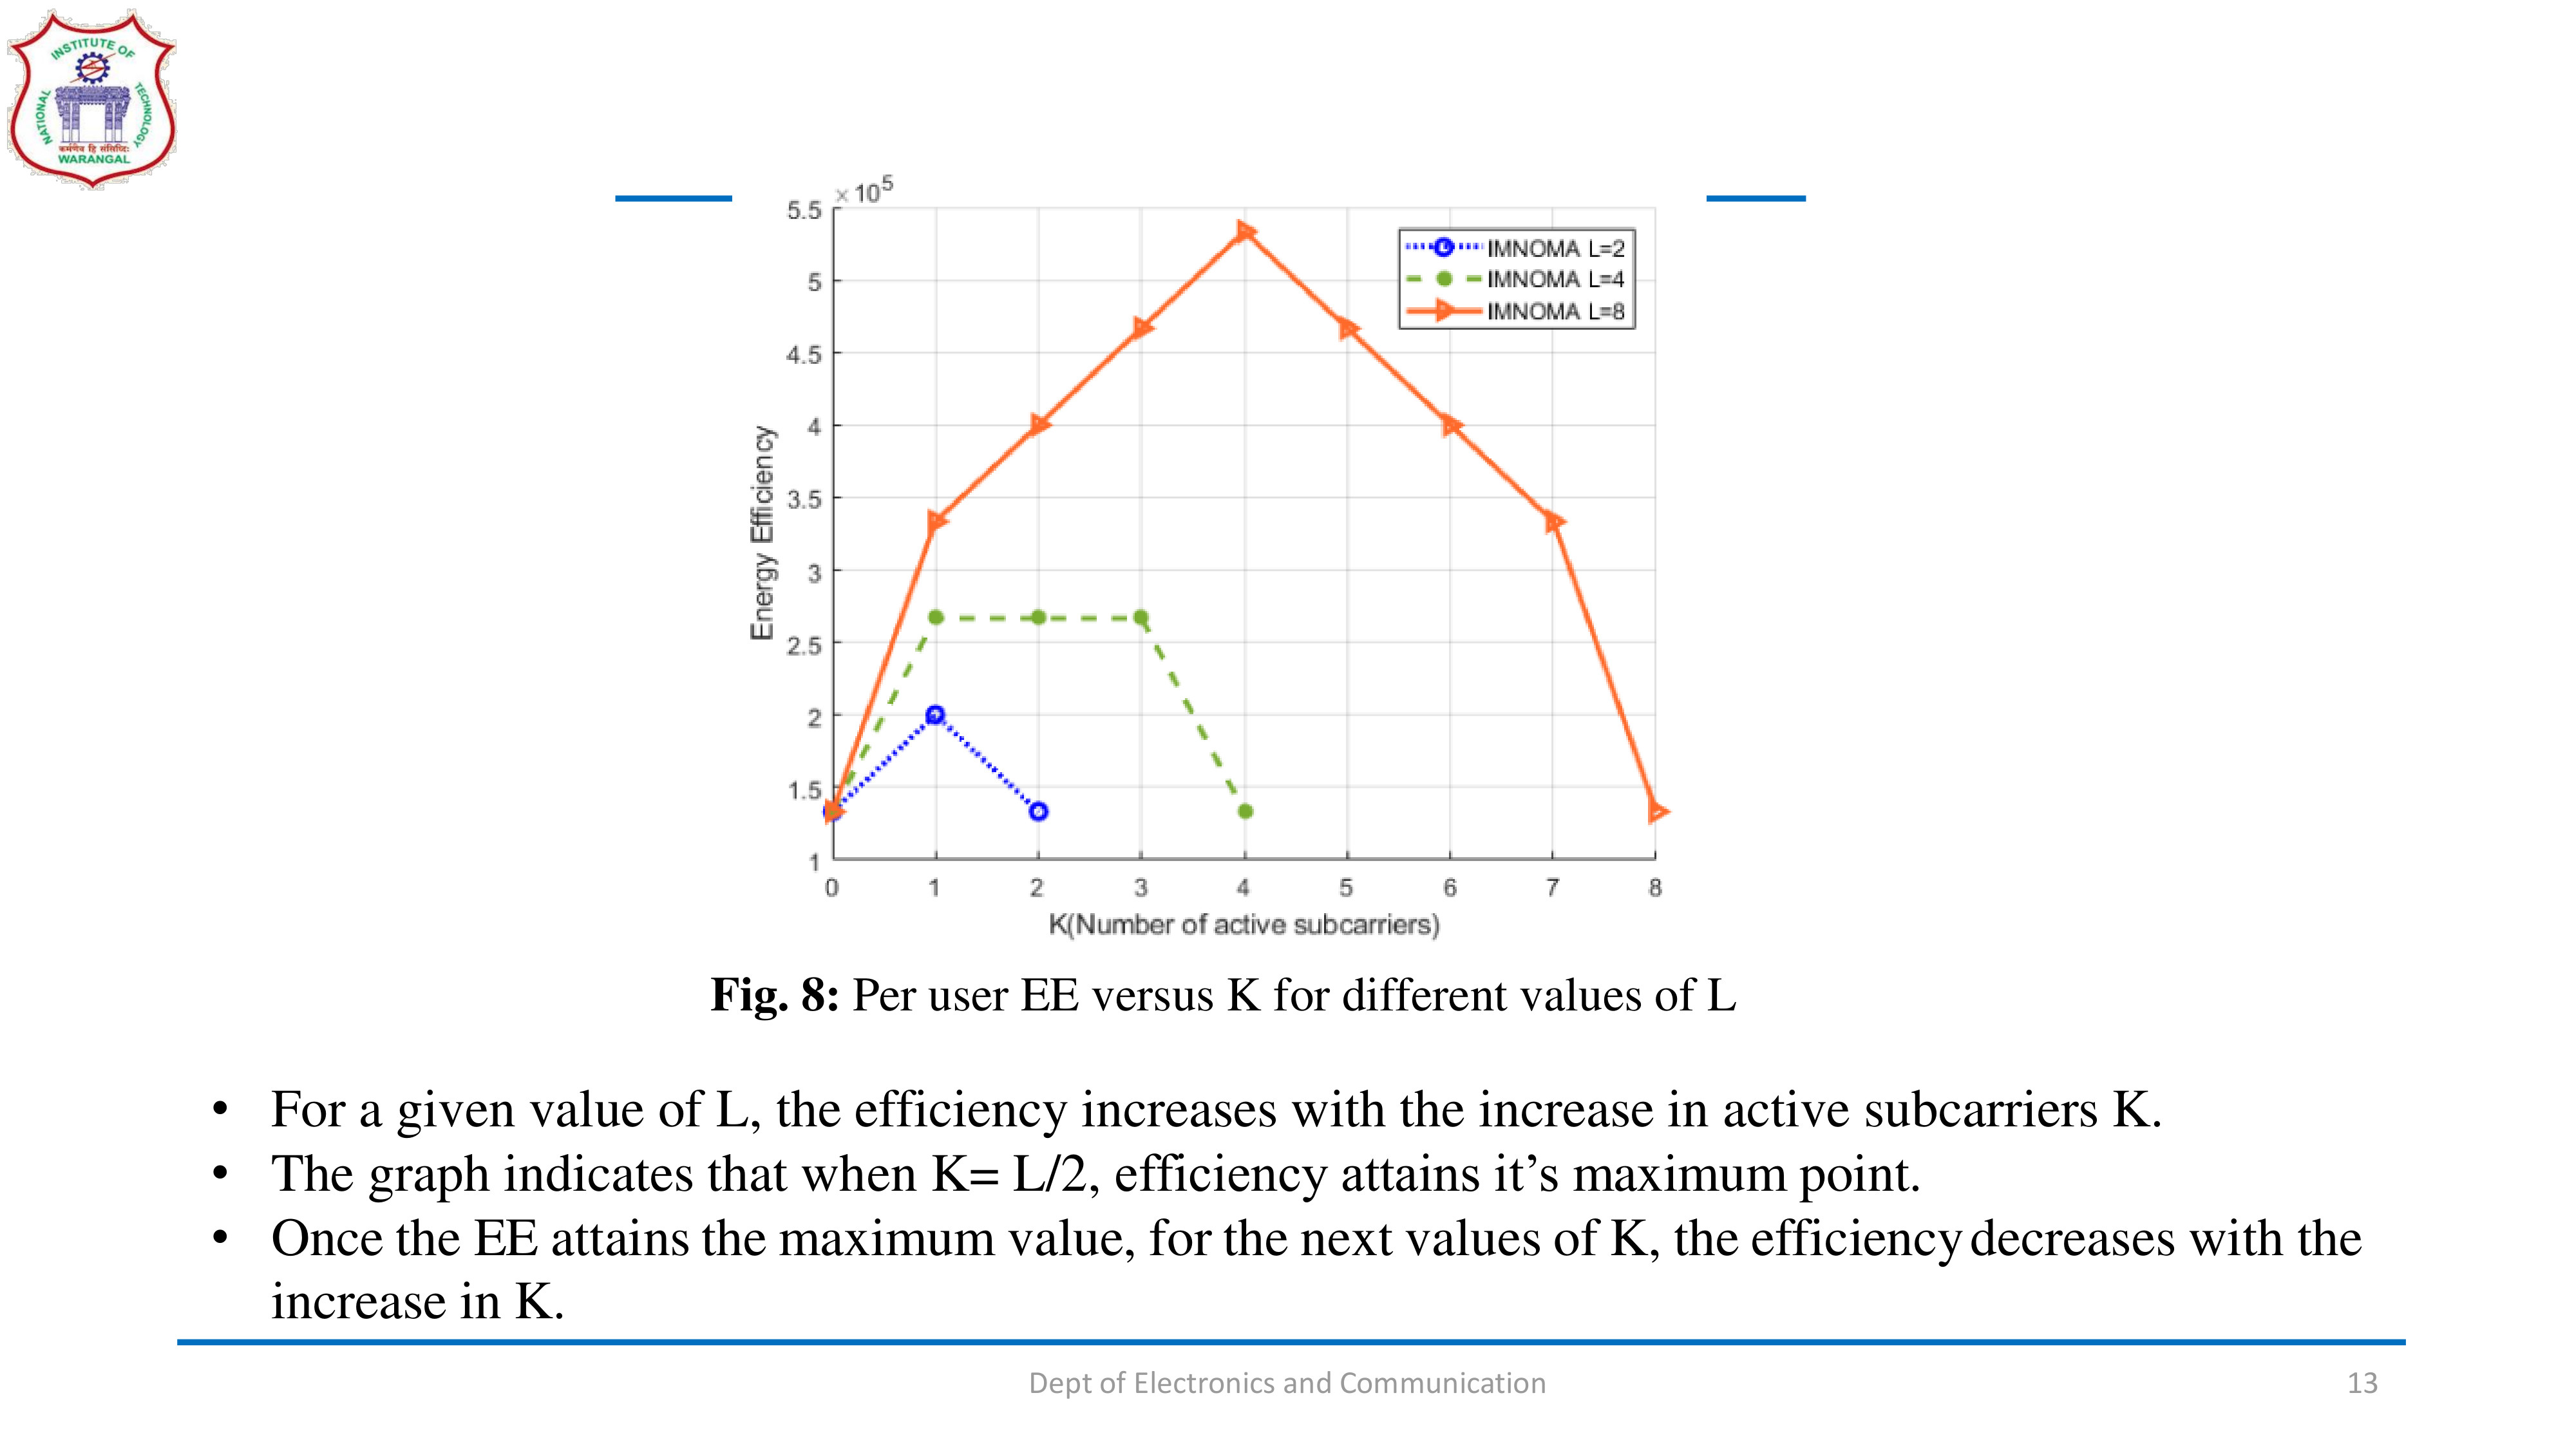
Fig. 8 represents the Per user EE versus K for different values of L. For a given value of L, the energy efficiency increases with the increase in active subcarriers K. The graph indicates that when K = L/2, the energy efficiency attains its maximum point. | |
| [Go to Next Slide] |