 |
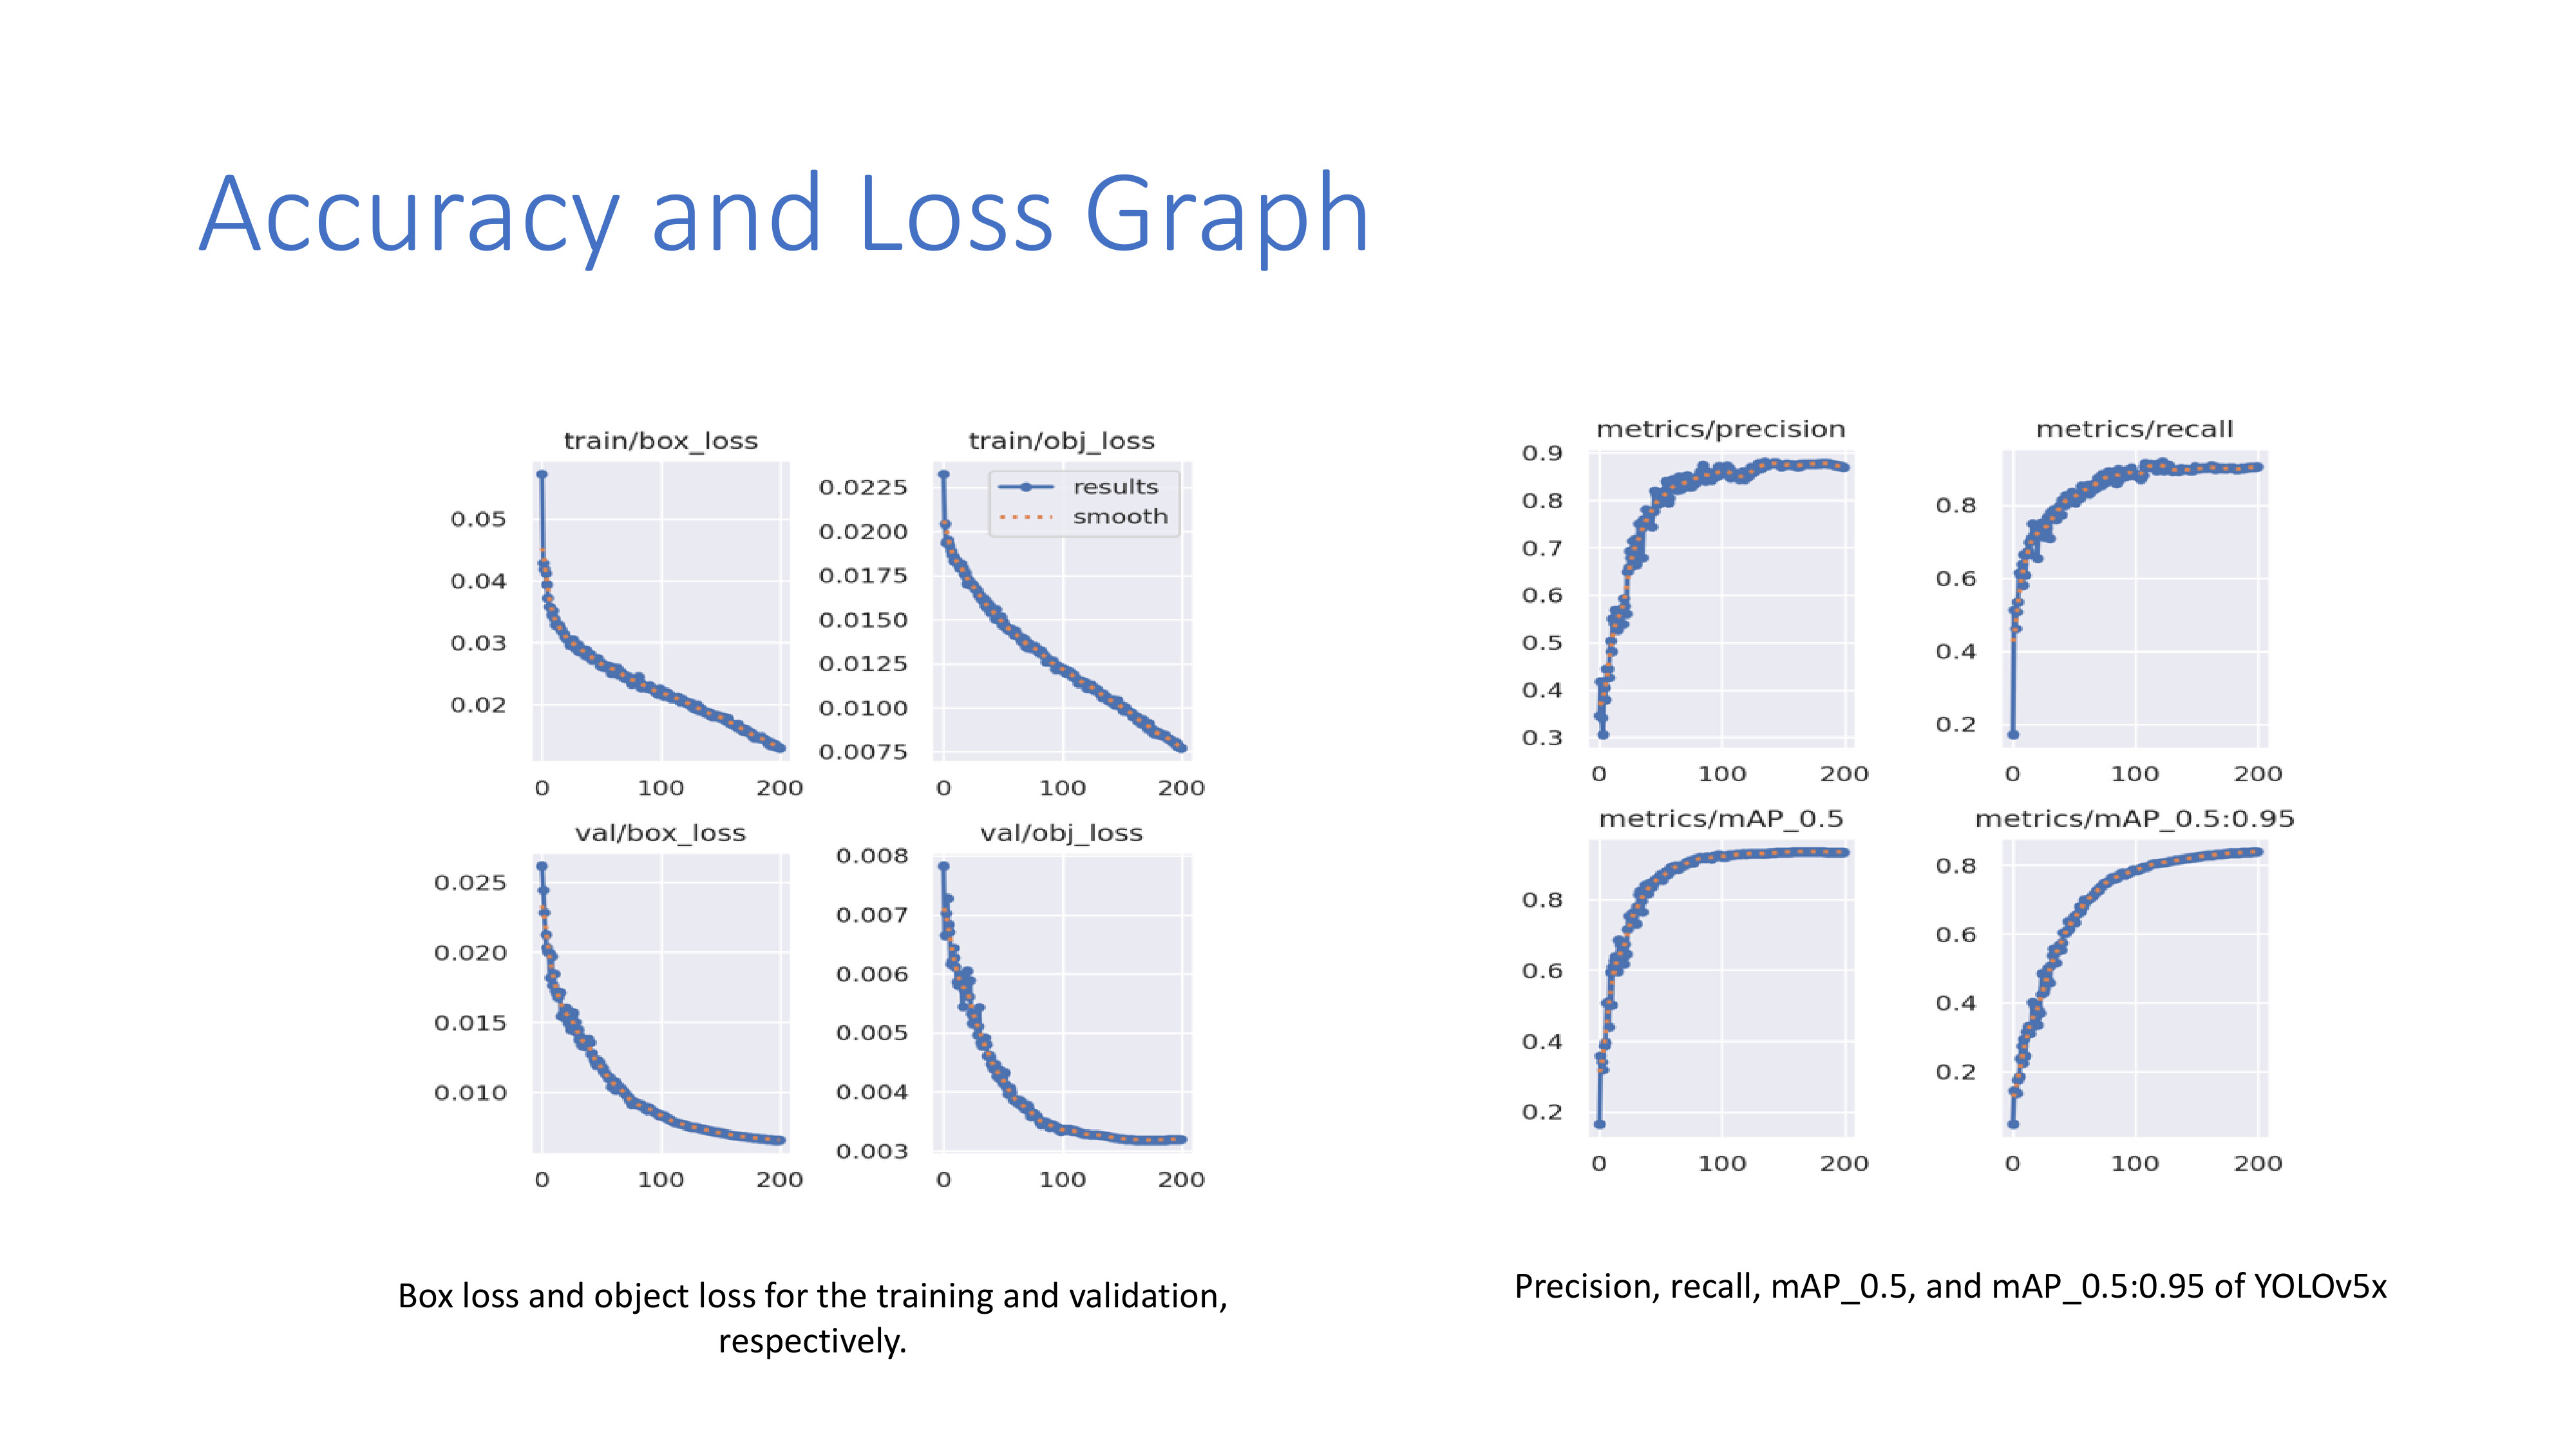
Now, let's delve into the 'Accuracy and Loss Graph' to gain deeper insights into our model's performance metrics. The graph showcases the box loss and object loss for both the training and validation phases, providing a visual representation of the learning dynamics.
Additionally, we'll examine key metrics, including precision, recall, mAP_0.5, and mAP_0.5:0.95 specifically for YOLOv5x. These metrics offer a comprehensive evaluation of the model's accuracy, sensitivity, and performance across various thresholds.
By analyzing these crucial indicators, we gain a nuanced understanding of the strengths and potential areas for improvement in our YOLOv5x model, shaping the discussion around the overall efficacy of our cervical spine bone detection system.
|
 IEEE/ICACT20240327 Slide.12
[Big Slide]