 |
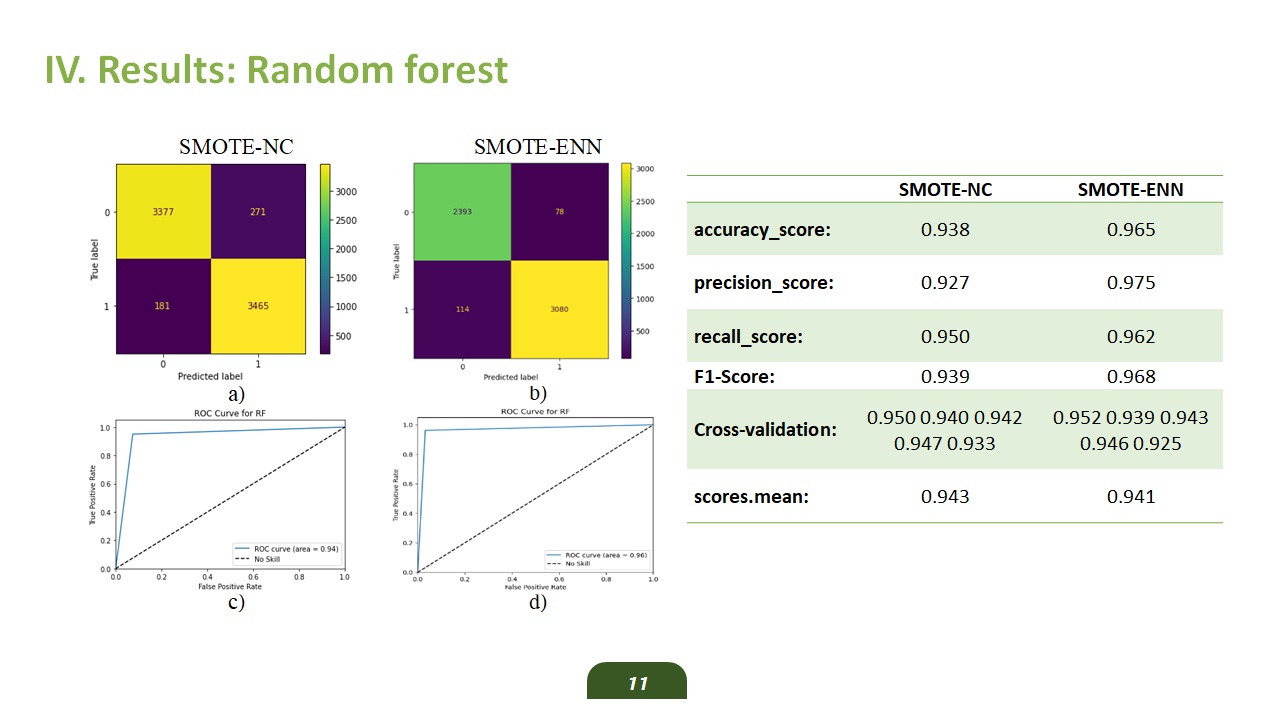
On the SMOTE-NC dataset, the RF model correctly predicts 3 465 positive outcomes and 3 377 negative outcomes. The number of false positives and false negatives is 271 and 181, respectively (Figure (a)). The area under curve AUC= 0.56 (Figure (c)). On the SMOTE-ENN dataset, the RF model correctly predicts 3,080 positive outcomes and 2 393 negative outcomes. The number of false positives and false negatives is 78 and 114, respectively (Figure (b)). The area under curve AUC= 0.96 (Figure (d)).
The first column of Table presents the accuracy, precision, recall, and F1-scores of the RF model in SMOTE-NC data. An accuracy score of 0.94, a precision score of 0.93, recall score of 0.95 and an F1-score of 0.94 indicate that the RF model performs very well on the SMOTE-NC dataset. However, the cross-validation scores for the entire SMOTE-NC dataset are not stable across folds and range from 0.93 to 0.95. This slight variation indicates that there is a small overfitting issue.
The second column of Table presents the accuracy, precision, recall, and F1-scores of the RF model on the SMOTE-ENN dataset. An accuracy score of 0.96, precision score of 0.97, recall score of 0.96, and F1-score of 0.97 indicate that the RF model performs very well on the SMOTE-ENN dataset. The cross-validation scores for the entire SMOTE-ENN dataset are slightly unstable across folds and range from 0.924 to 0.952. This variation suggests a potential overfitting issue.
|
 IEEE/ICACT20250136 Slide.12
[Big Slide]