 IEEE/ICACT20260055 Slide.12
[Big Slide]
Oral Presentation
| Virual Oral Presentation Slide by Slide |
|
IEEE/ICACT20260055 Slide.12
[Big Slide]
| Oral Presentation |
|
|
|
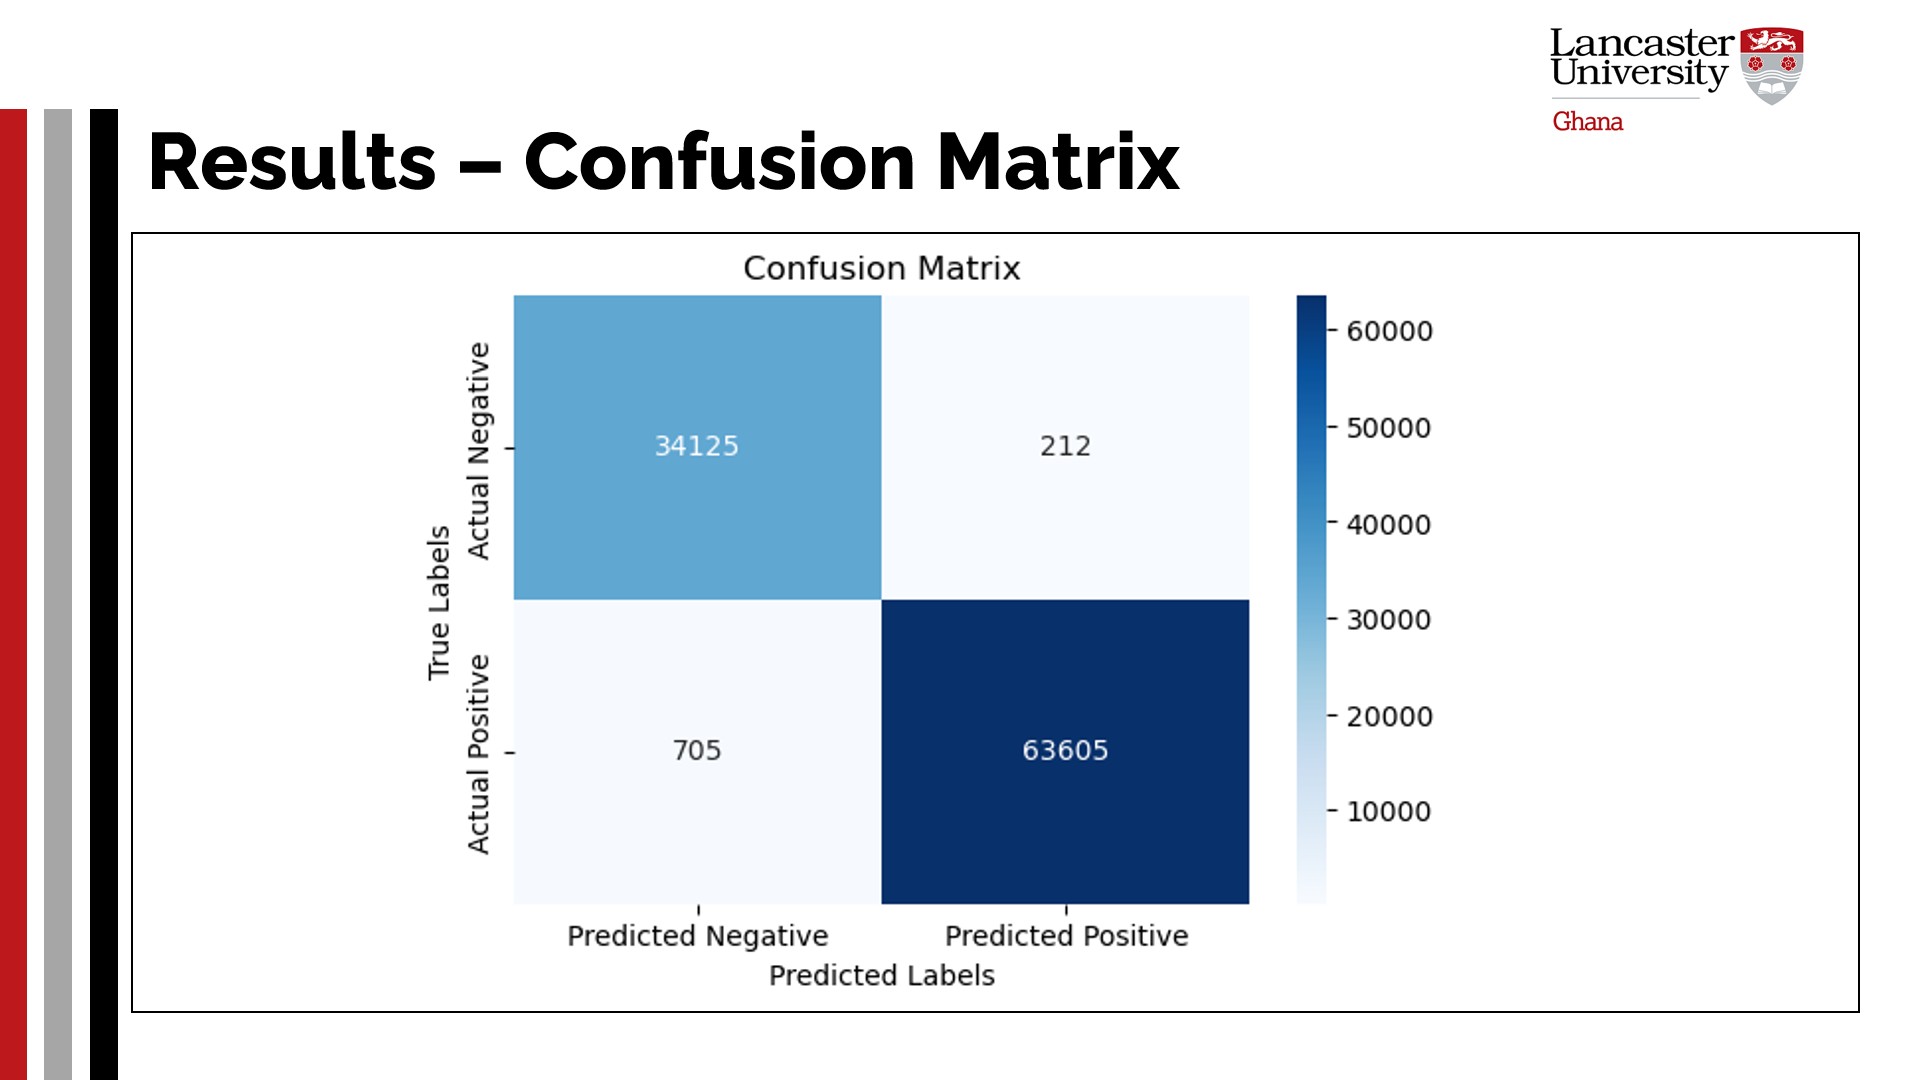
The illustration in the figure presents the confusion matrix score of the introduced CNN + ViT model. This is a key metric to further view the performance of the model. The figure shows that the model correctly predicted the most negative (34125) and positive (63605) data instances. Yet, a relatively small set of these instances was misclassified and should be improved. | |
| [Go to Next Slide] |