 IEEE/ICACT20220332 Slide.13
[Big Slide]
[YouTube] Oral Presentation
| Virual Oral Presentation Slide by Slide |
|
IEEE/ICACT20220332 Slide.13
[Big Slide]
[YouTube] |
Oral Presentation |
|
|
|
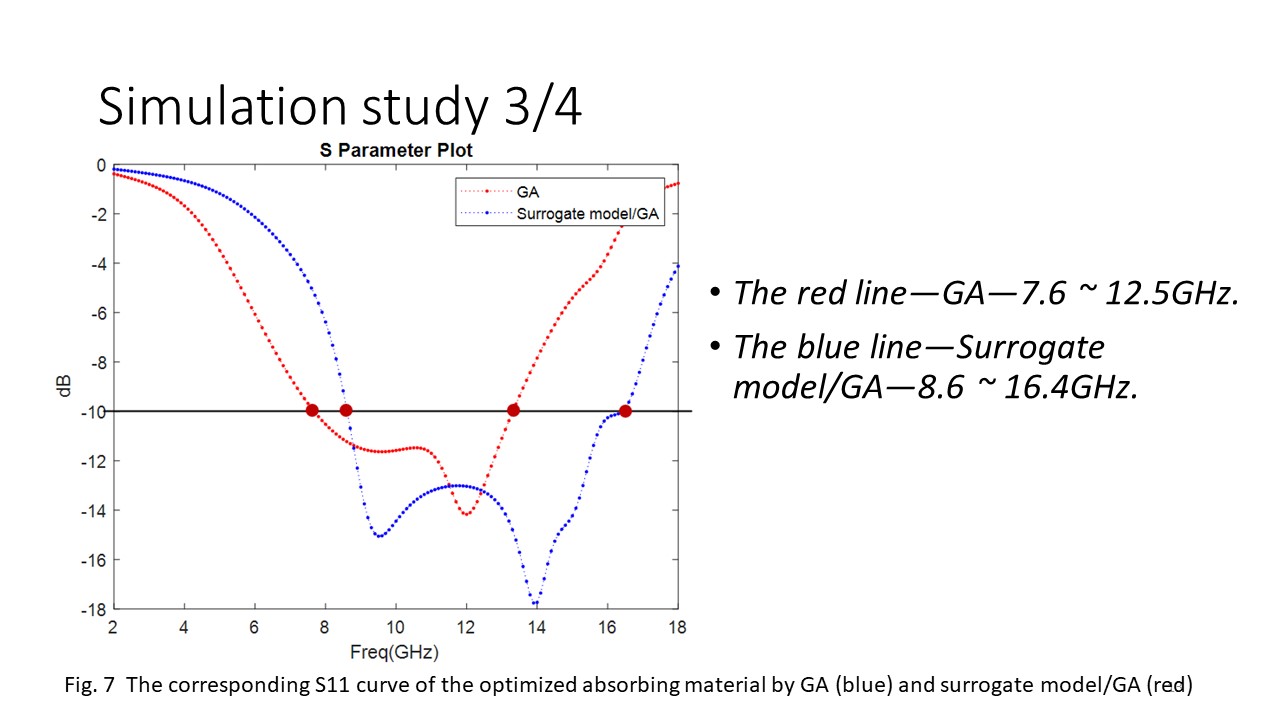
This figure shows the corresponding S11 curve of the final structure. The red line shows that the structure optimized by GA could absorb wave in 7.6 ~ 12.5GHz, while the blue line shows that the structure optimized by Surrogate model/GA could absorb wave in 8.6 ~ 16.4GHz. | |
| [Go to Next Slide] |