 IEEE/ICACT20250190 Slide.13
[Big Slide]
Oral Presentation
| Virual Oral Presentation Slide by Slide |
|
IEEE/ICACT20250190 Slide.13
[Big Slide]
| Oral Presentation |
|
|
|
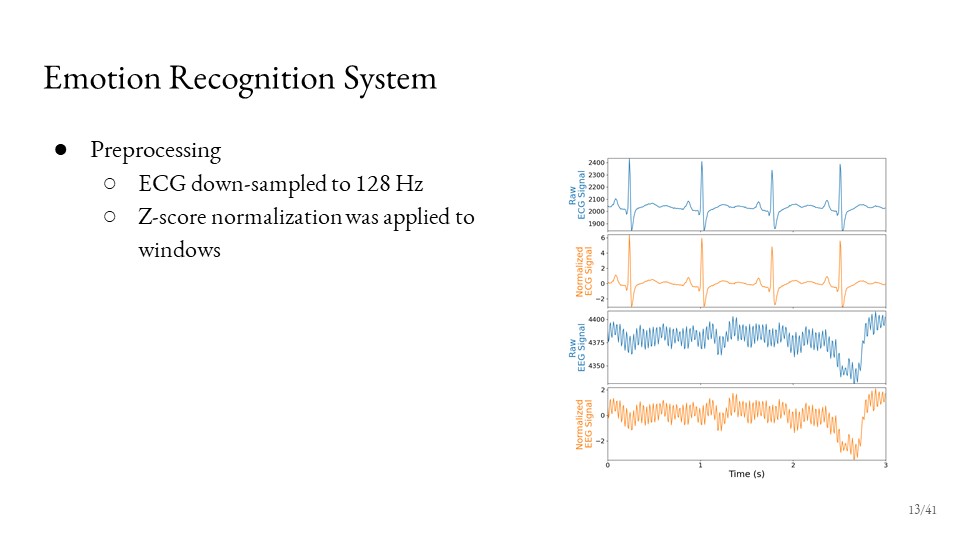
The ECG data was down-sampled from 256 Hz to 128 Hz, whereas the frequency of EEG signals is already 128 Hz. In order to eliminate the information that the windows belong to the same signal, Z-score normalization was applied to each window. The figure displays raw and normalized ECG and EEG signals of the first 3 seconds of the first participant's amusement trial. | |
| [Go to Next Slide] |