 |
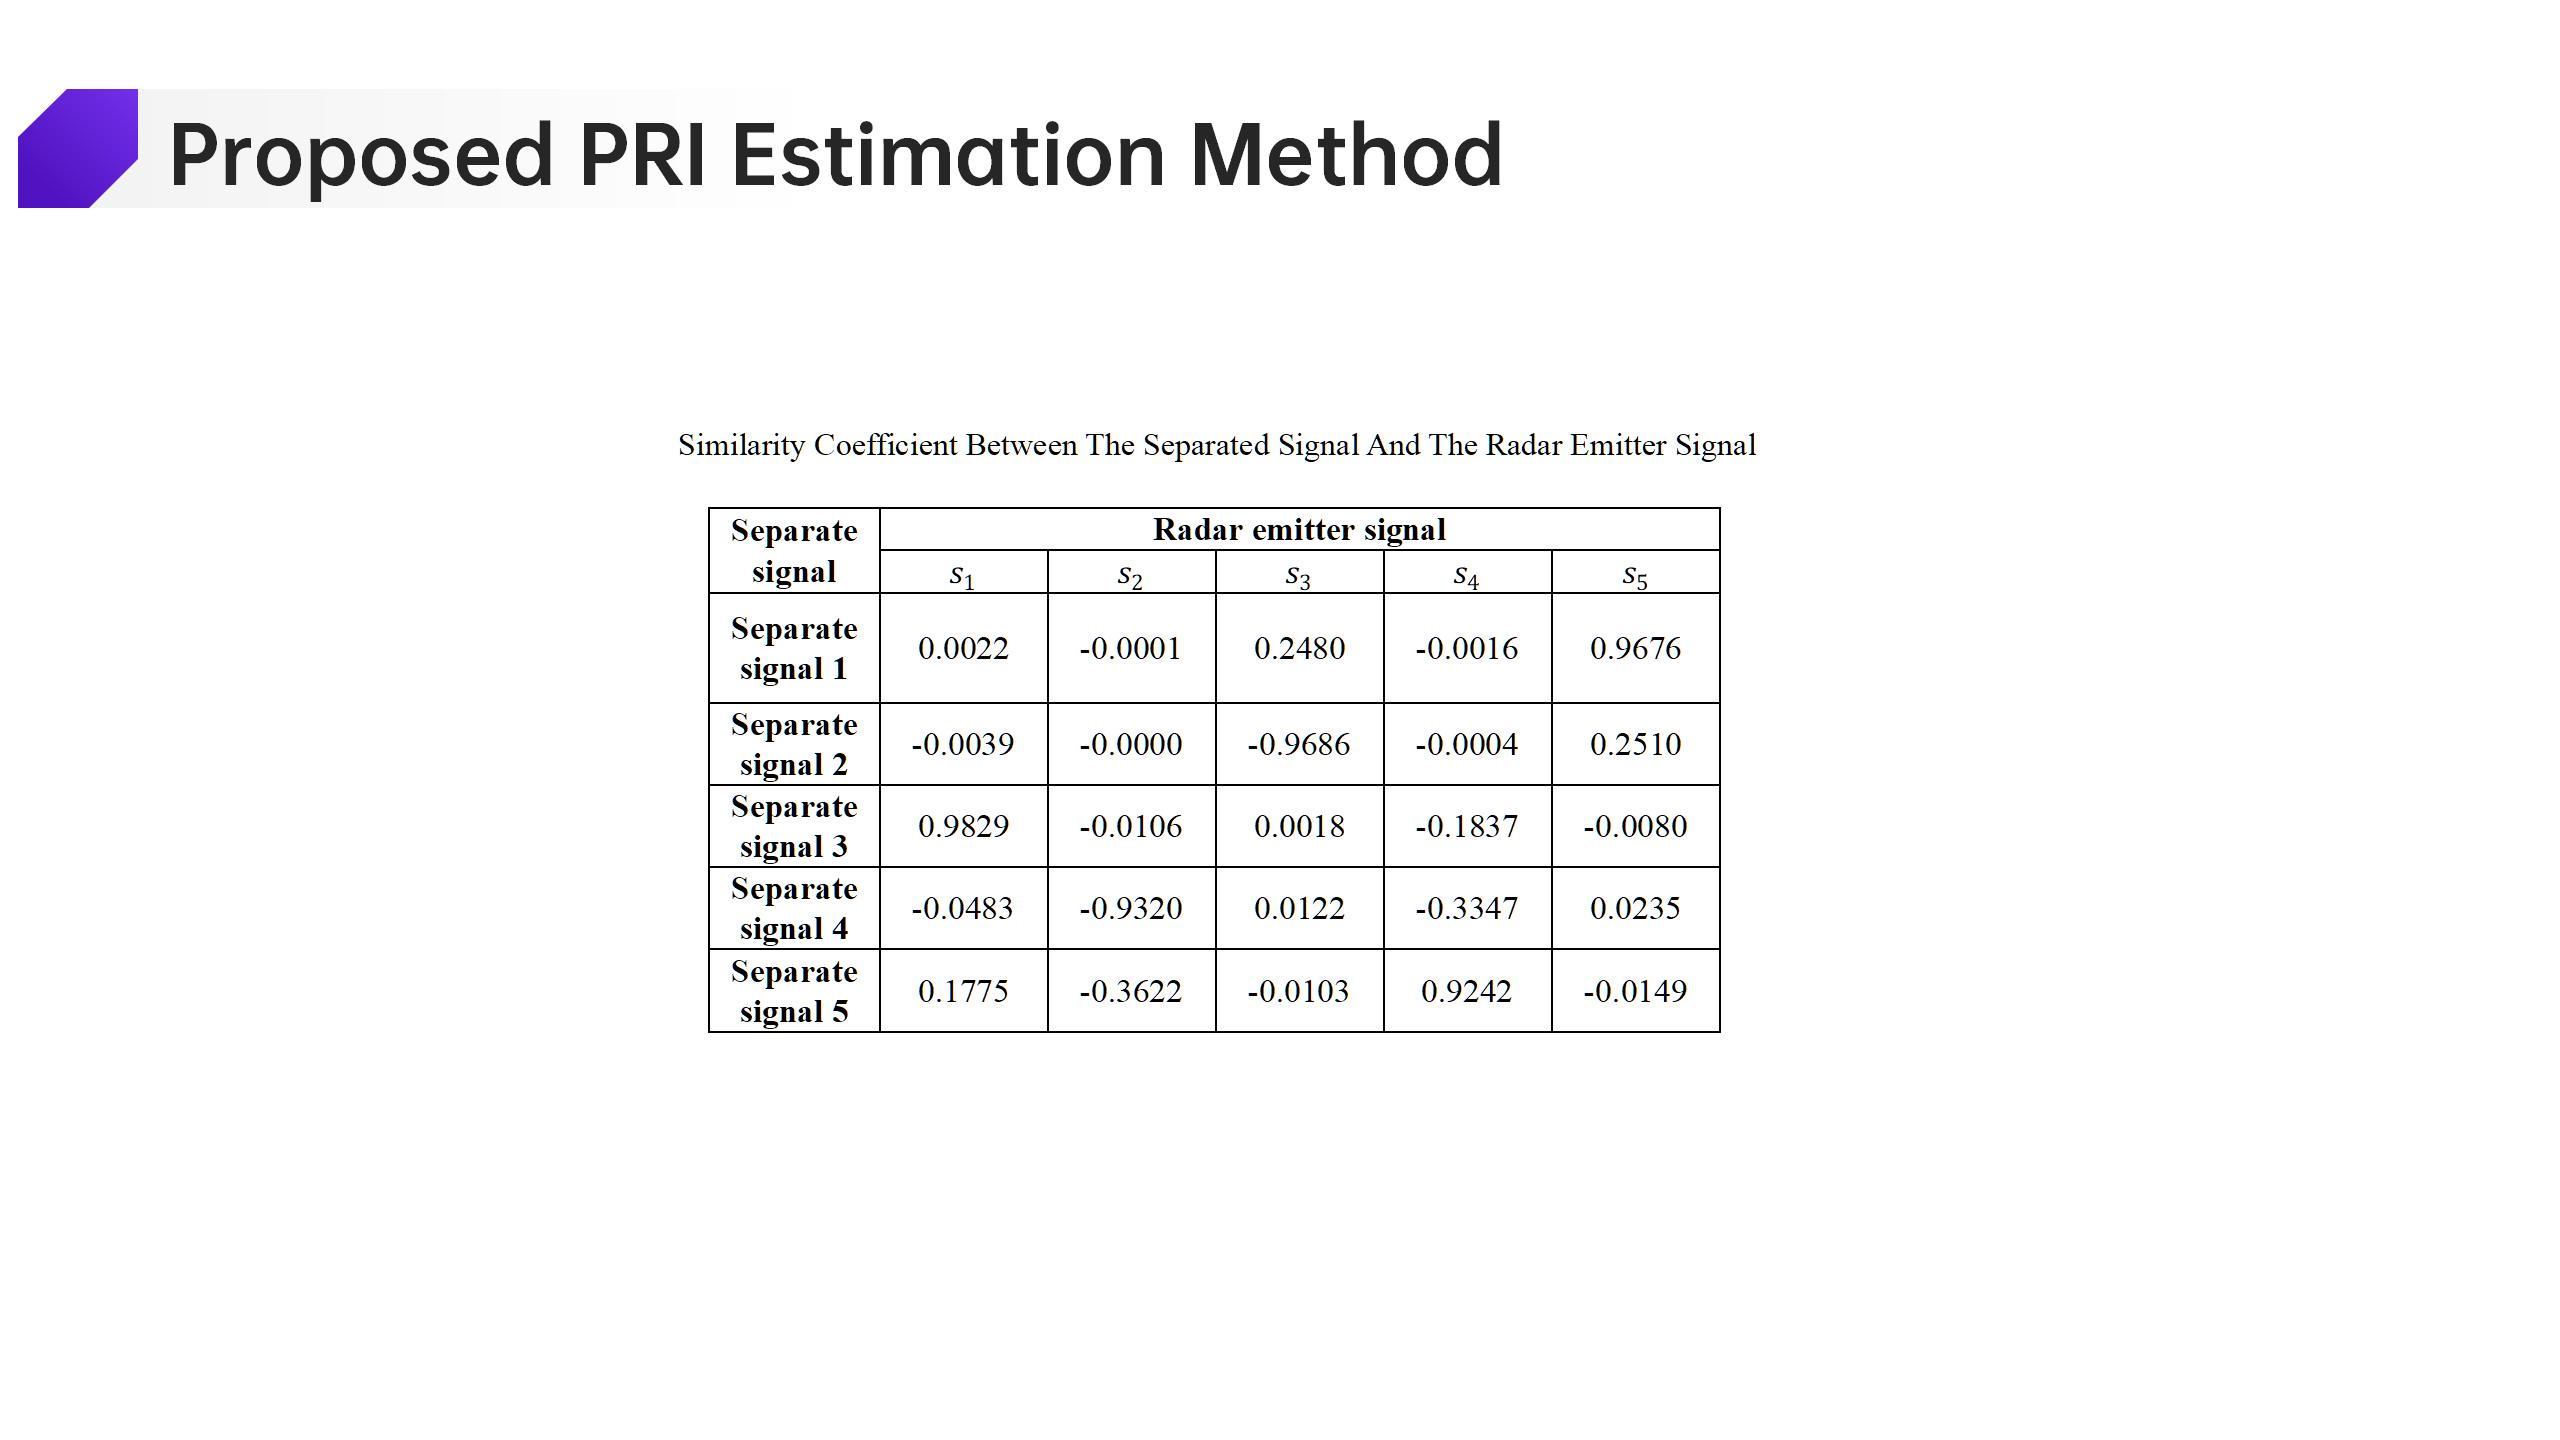
In Table 1, the underlined values represent the similarity coefficients between separated signals and radar emitter signals. The coefficient's sign does not impact the signal information; only its absolute value matters, with values closer to 1 indicating better results. The table shows high similarity between separated signals and their corresponding radar emitter signals, such as 0.9676 for separation signal 1 and the fifth emitter, -0.9686 for signal 2 and the third emitter, and 0.9829 for signal 3 and the first emitter, demonstrating excellent separation performance.
|
 IEEE/ICACT20250229 Slide.13
[Big Slide]