 IEEE/ICACT20250232 Slide.13
[Big Slide]
Oral Presentation
| Virual Oral Presentation Slide by Slide |
|
IEEE/ICACT20250232 Slide.13
[Big Slide]
| Oral Presentation |
|
|
|
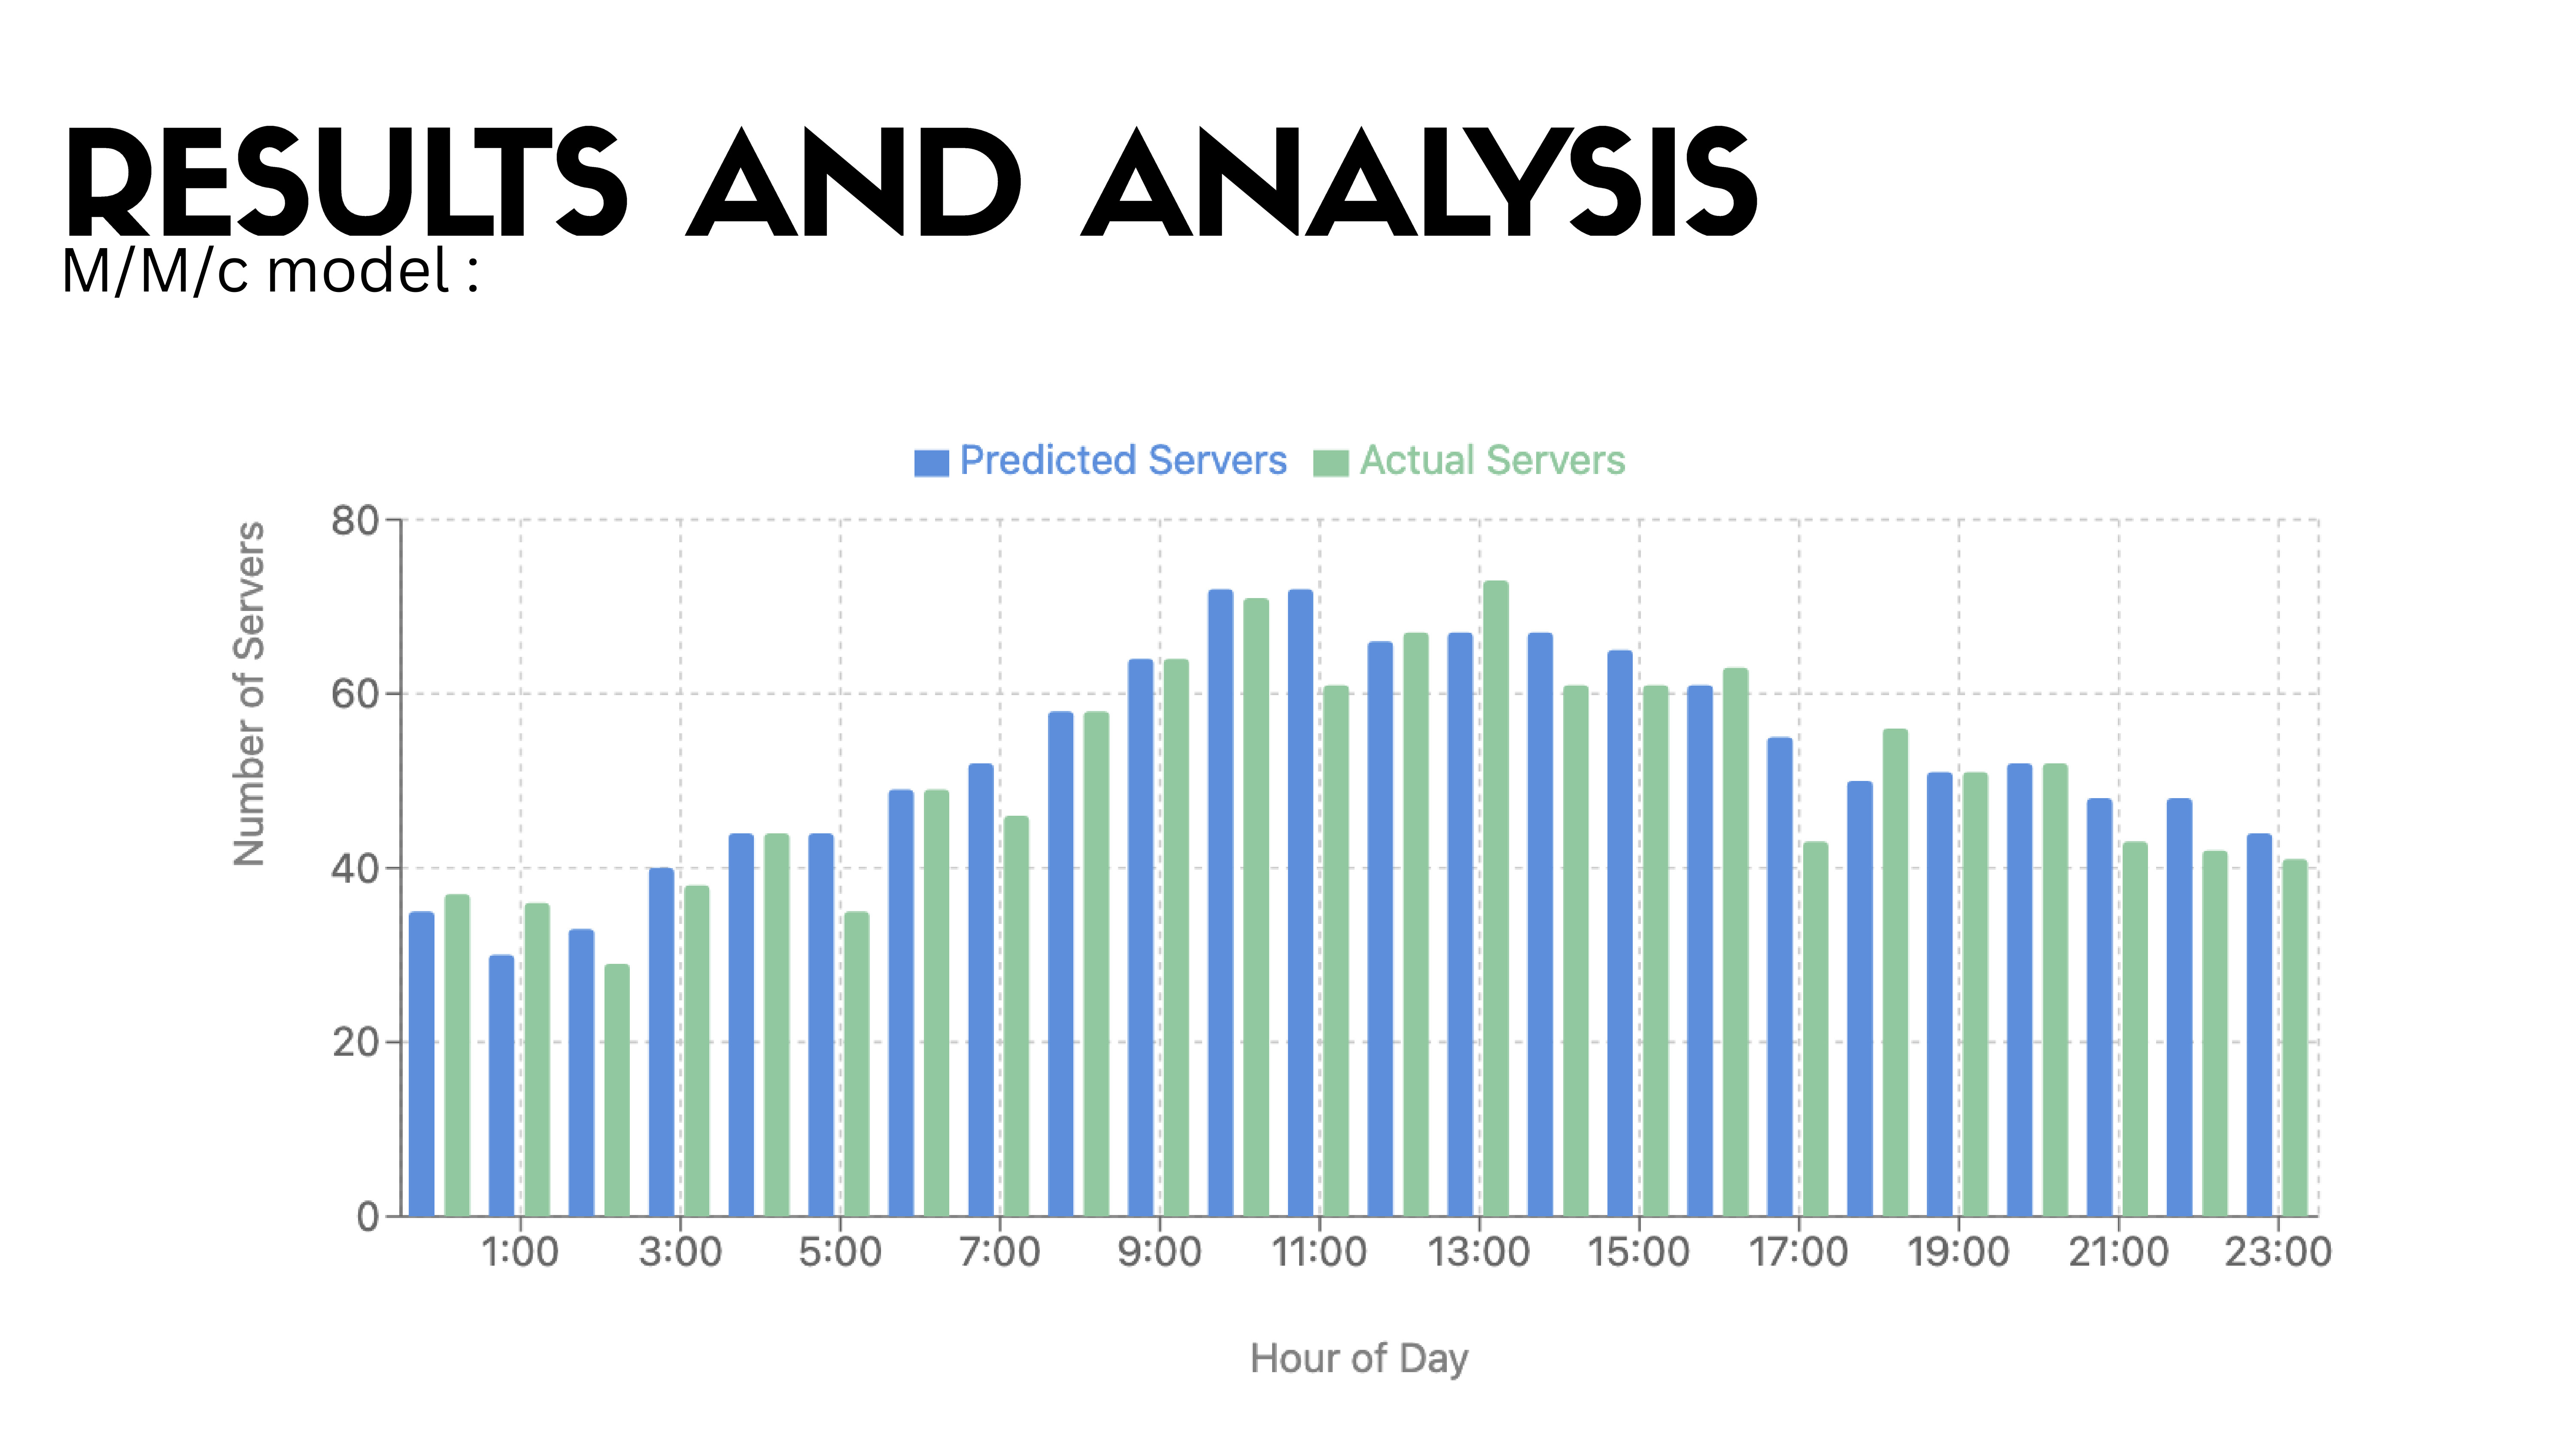
The M/M/c model was used to determine the number of servers required for each hour based on the time series predictions. The graph compares the predicted number of servers calculated based on the model predictions with the actual number of servers required at each hour based on test data. | |
| [Go to Next Slide] |