 |
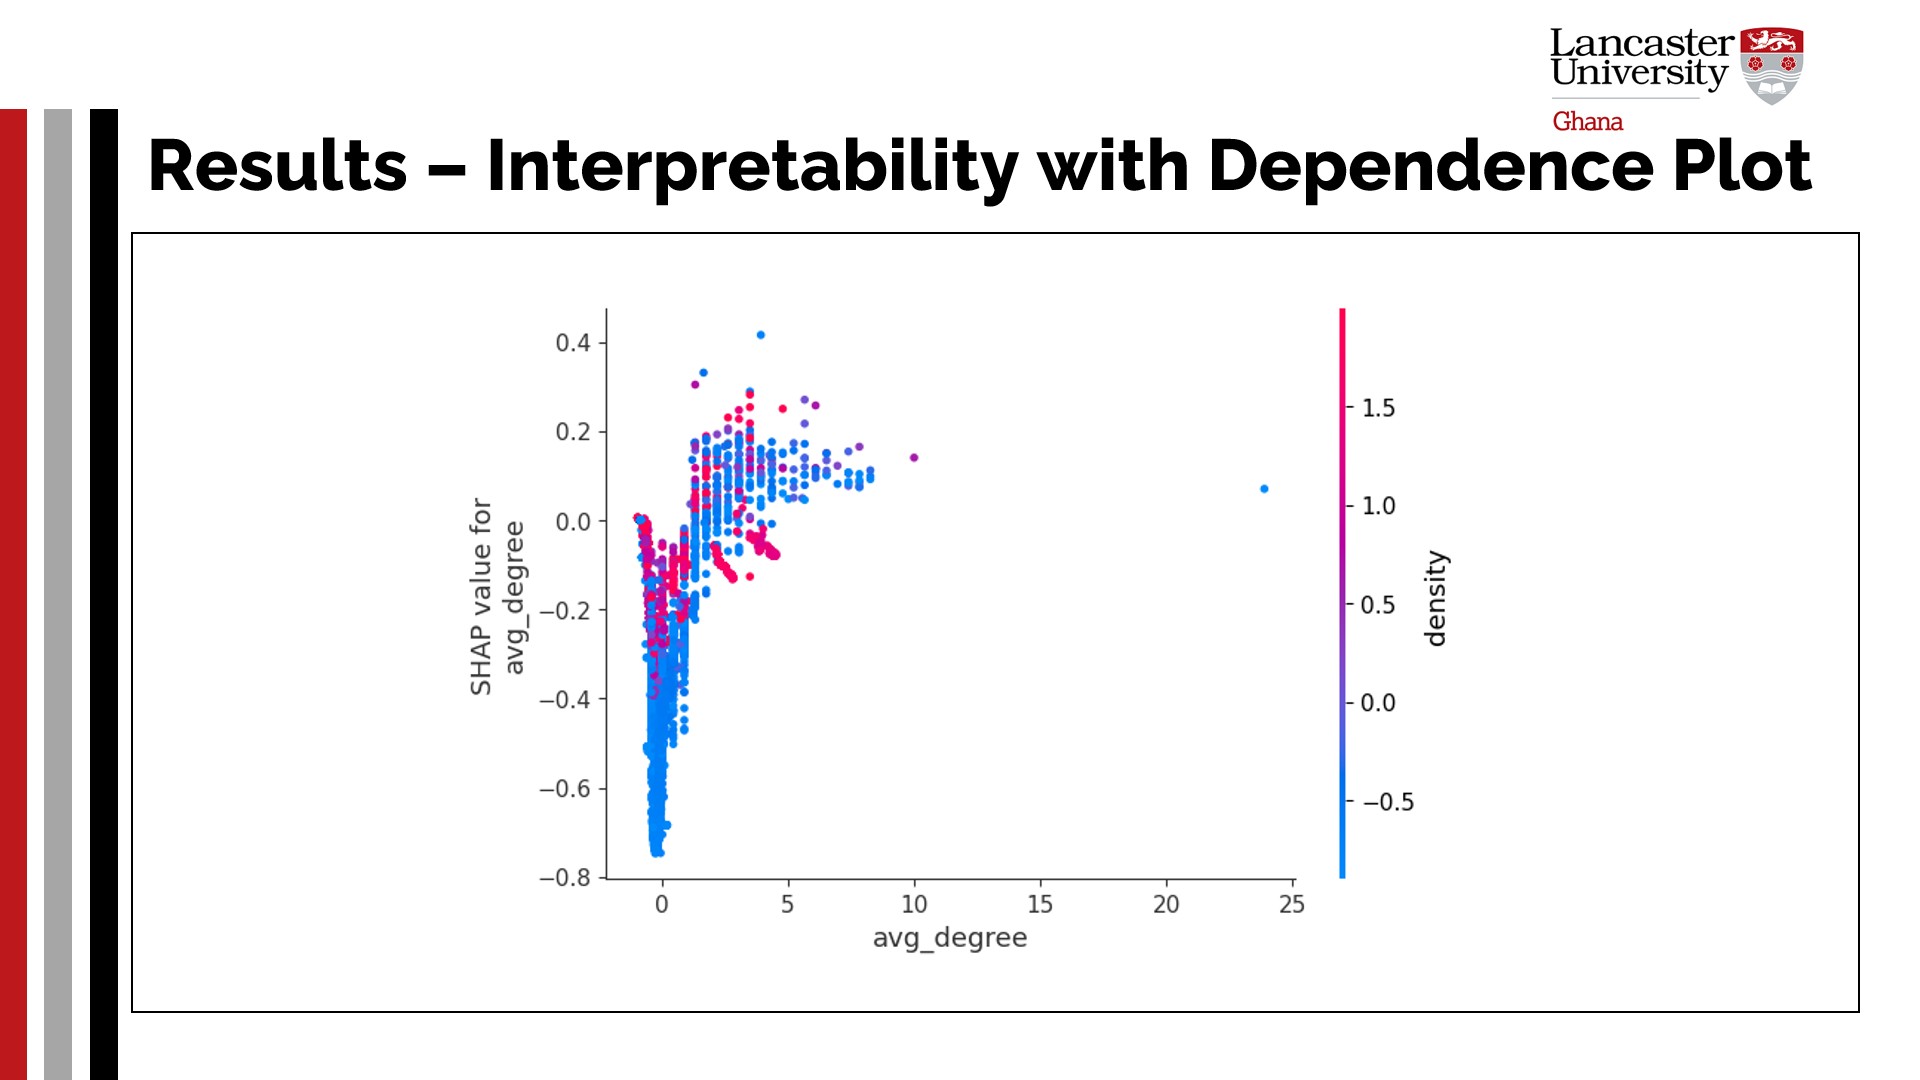
From the plot, density, avg_shortest_path, and avg_children proved to be dominant red or negative contributors. However, the avg_degree was strong enough with the base value to predict in favour of Class 1. This study further visualises the highest-ranked feature to understand its relationship with its SHAP value, as shown in the figure. This SHAP dependence plot provides insights into the avg_degree feature and its relationship with the output of the model, as well as its interaction with density. The horizontal axis in the figure represents the actual values of this feature across the dataset, while the vertical axis represents its impact (SHAP values) on predictions. Each dot in the plot represents an individual observation from the dataset. A colour bar is included to measure the density value concerning the chosen feature. Deducing from the figure, most low SHAP values (negative or close to zero) of avg_degree have little or no positive impact on the prediction. Additionally, a lower density further reduces the SHAP value. As the SHAP values of avg_degree increase, it indicates that this has a positive impact on the prediction. Again, with higher density, these values increase more. Yet, there exists an outlier where a high avg_degree value corresponds to a low SHAP value. Overall, it can be inferred that the avg_degree feature, on average, has a positive impact on the prediction as its SHAP value increases. The avg_degree feature was found to have a greater positive influence at higher densities, but its effect was diminished, and SHAP values declined at lower densities. Finally, the SHAP values of avg_degree rose and remained continuously positive, indicating that the model primarily relied on it to make decisions.
|
 IEEE/ICACT20260055 Slide.13
[Big Slide]