 |
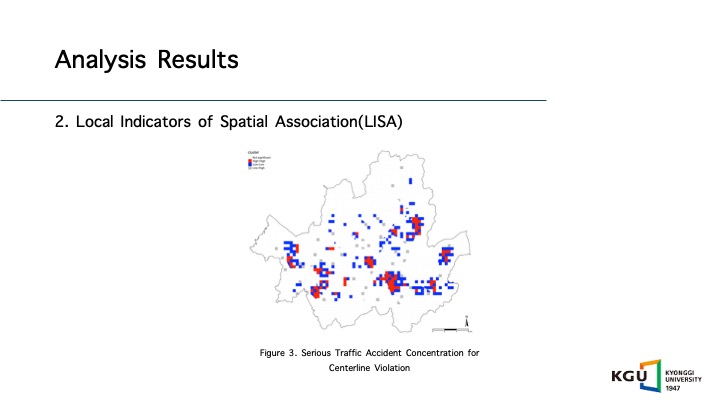
Figure 3 visualizes the concentration of traffic accident hot spot sites in the city.
The LISA map shows statistically significant clusters of high-high and low-low areas.
Grid areas colored in red represent high-high concentrations, while blue areas indicate low-low concentrations.
For centerline violations, several high-high clusters are observed across the city, with particularly significant concentrations in Gangnam-gu.
Areas adjacent to these high-accident zones also tend to experience a high volume of accidents.
Similar hot spot clusters are observed in Guro-gu, Dongdaemun-gu, and Yeongsan-gu.
|
 IEEE/ICACT20260100 Slide.13
[Big Slide]