 |
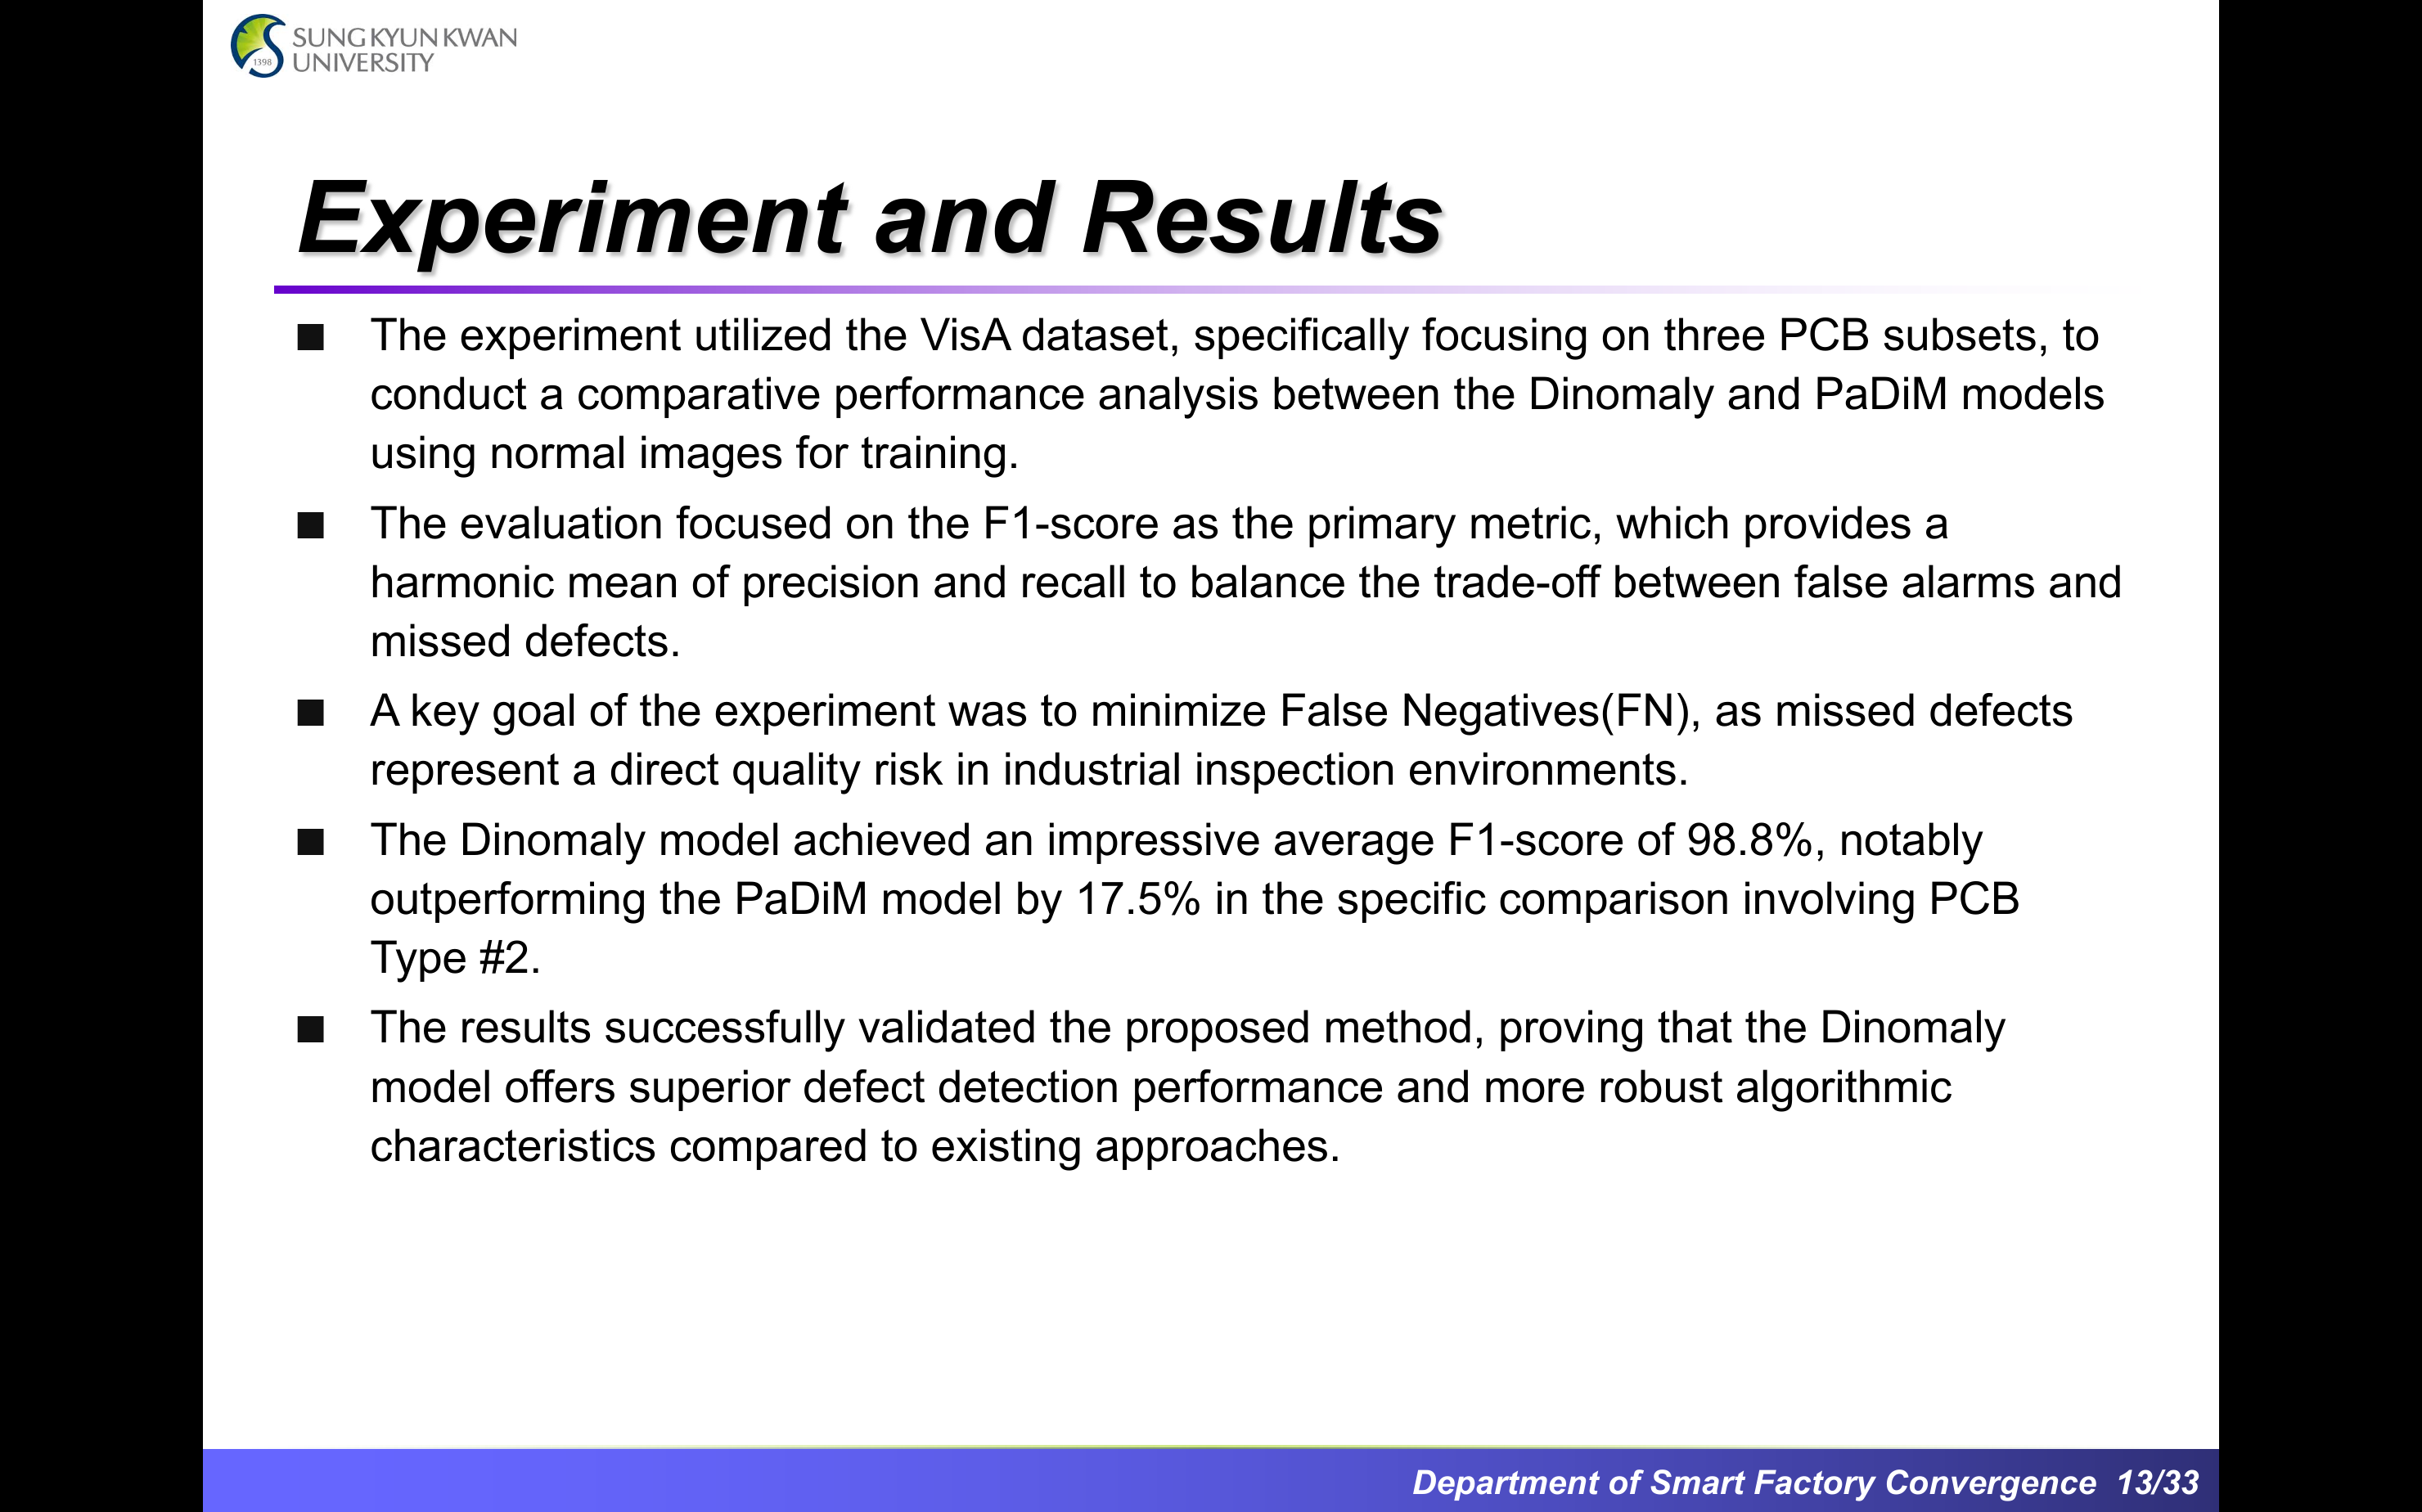
To summarize our experimental findings upfront: the experiment utilized the VisA dataset, specifically focusing on three PCB subsets. We conducted a comparative performance analysis between the Dinomaly and PaDiM models. The evaluation focused on the F1-score as the primary metric, and a key goal was to minimize false negatives, as missed defects represent a direct quality risk. The Dinomaly model achieved an impressive average F1-score of 98.8 percent, outperforming the PaDiM model by 17.5 percent on PCB Type number 2. |
 IEEE/ICACT20260190 Slide.13
[Big Slide]