 |
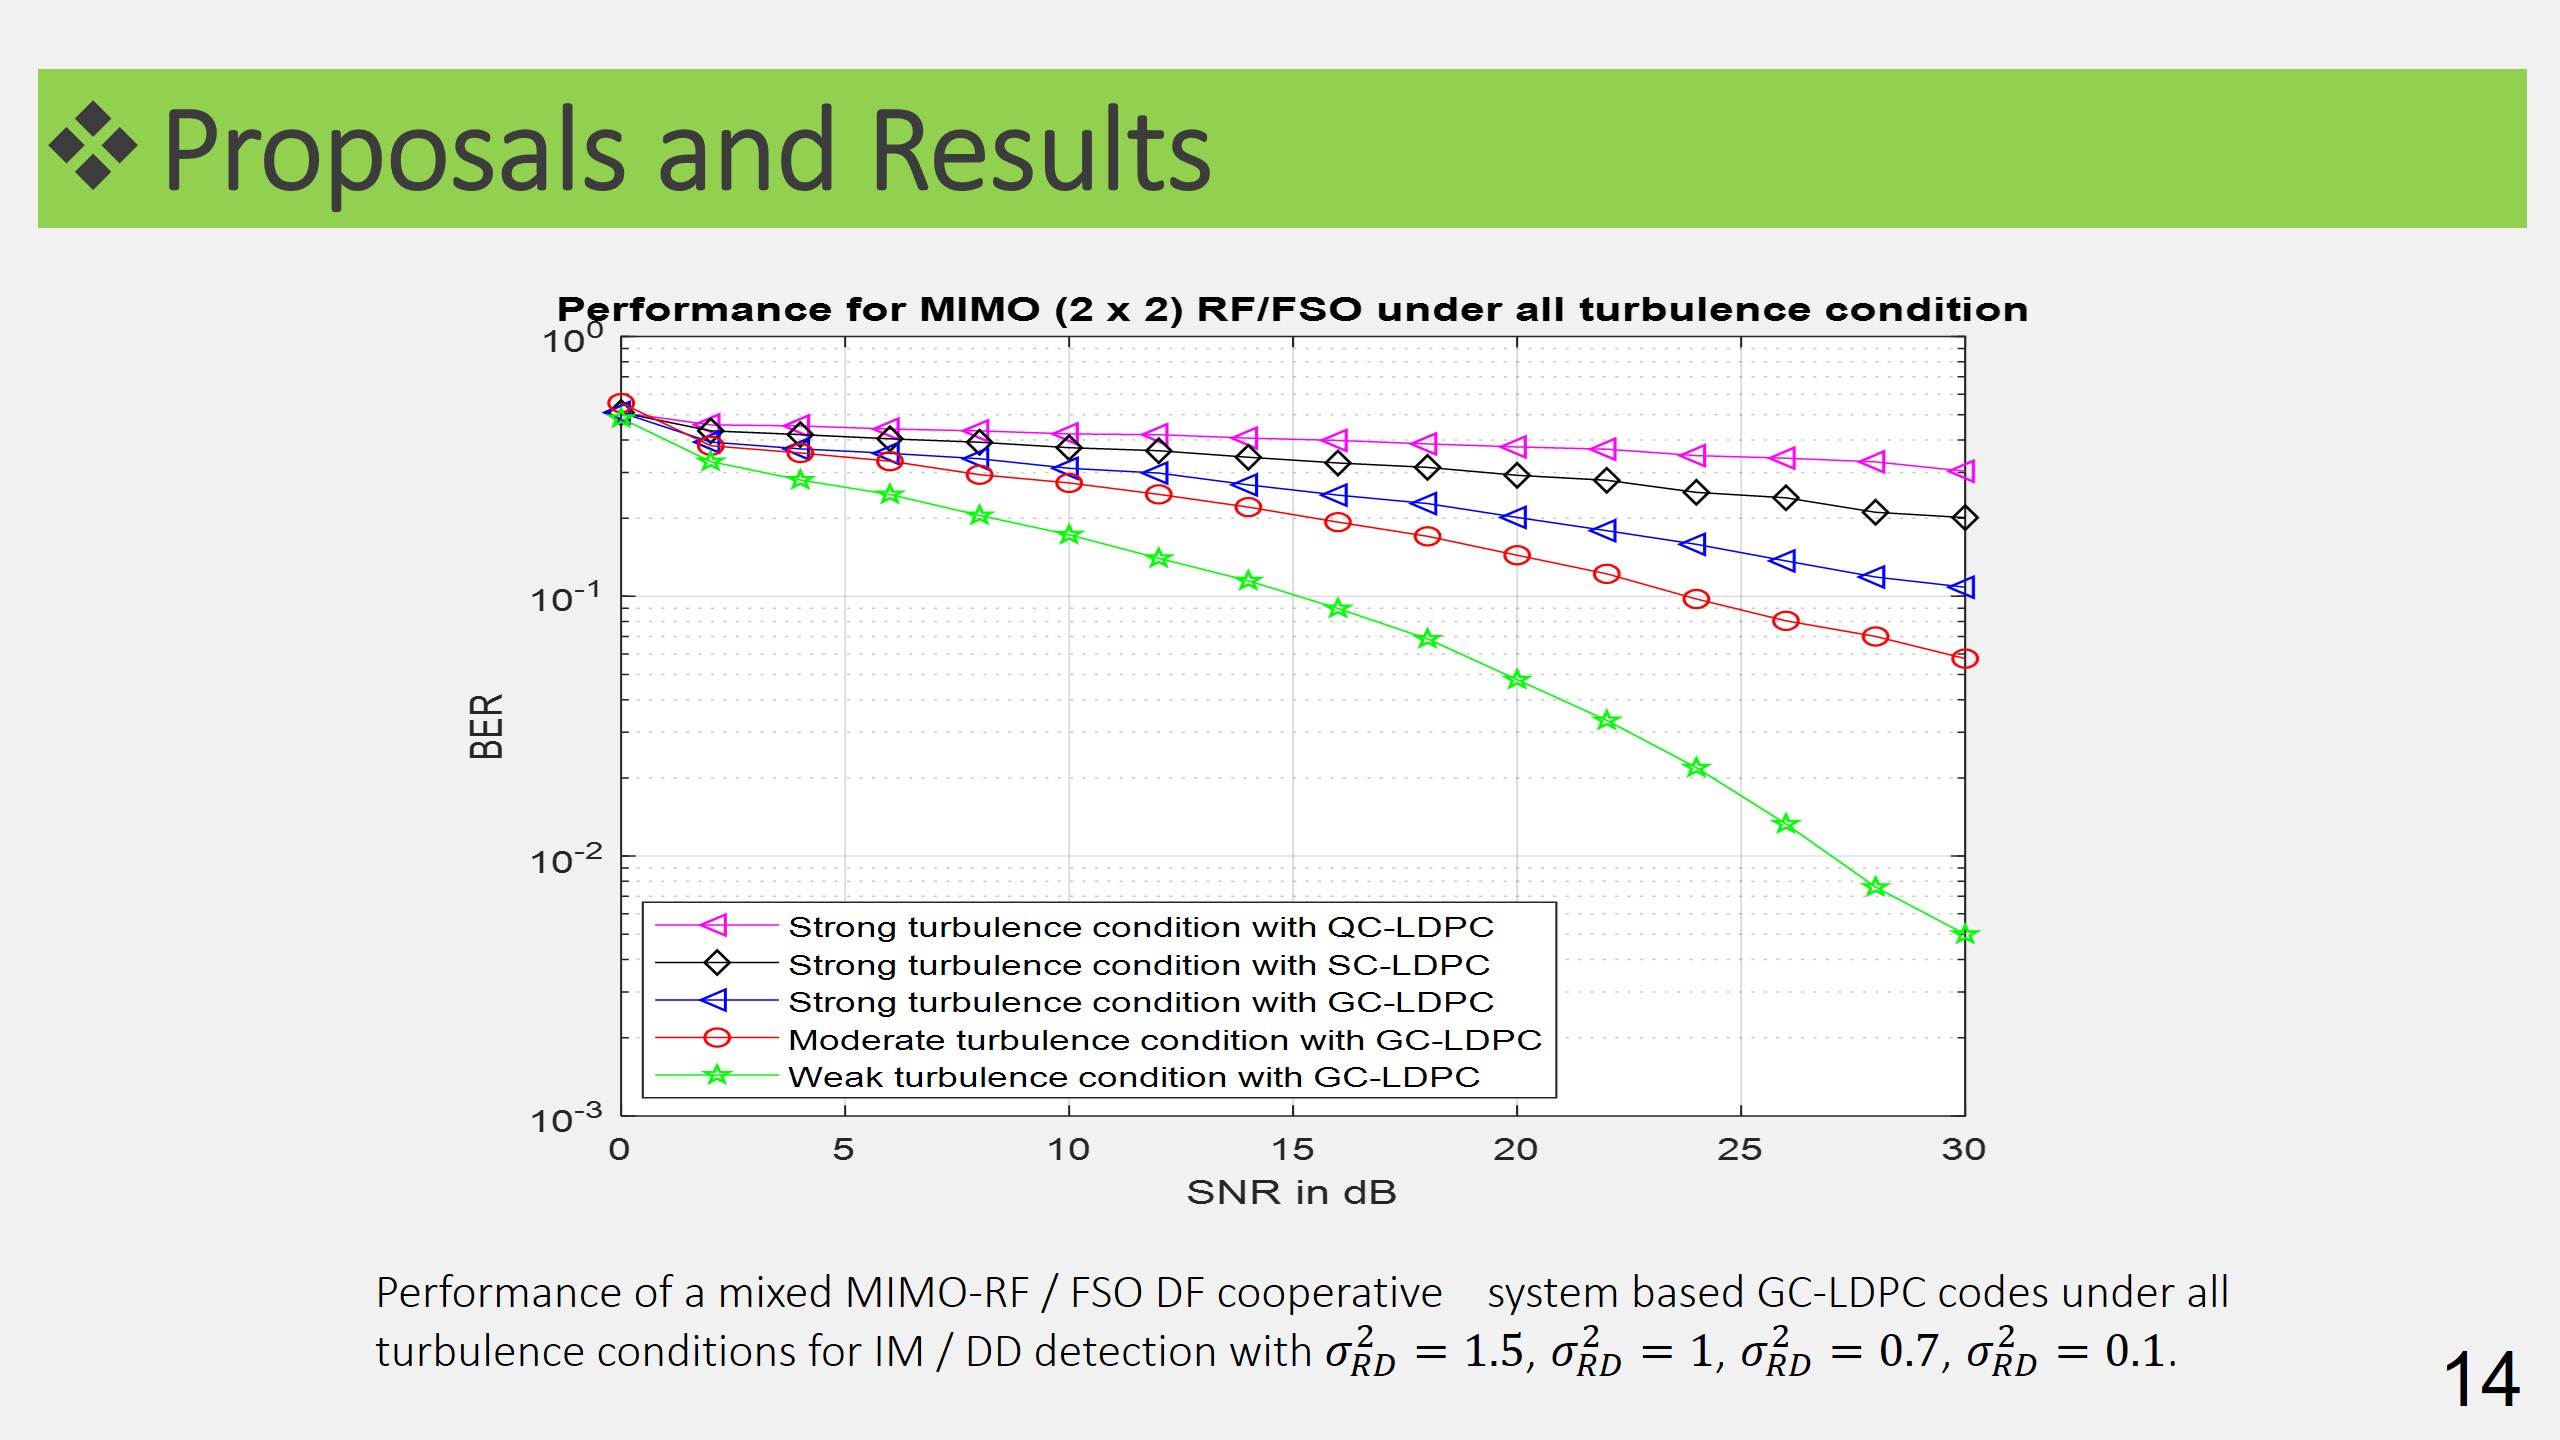
Figure shows the BER versus mean SNR graph to assess the influences of atmospheric turbulence parameters 𝜎_𝑅𝐷^2 the robustness of the GC-LDPC codes for conditions of strong and moderate atmospheric turbulence as well as for conditions of weak atmospheric turbulence.
In it can be clearly seen that smaller values 𝜎_𝑅𝐷^2, i.e. lower atmospheric turbulence, give better performance compared to schemes with higher values 𝜎_𝑅𝐷^2, i.e stronger atmospheric turbulence. Here we obtained BER performance that is better for low turbulent revs compared to moderate and high turbulence environments. The graph shows that the performance of the system deteriorates as the force of the turbulence increases.
|
 IEEE/ICACT20210117 Slide.14
[Big Slide]