 IEEE/ICACT20210130 Slide.14
[Big Slide]
Oral Presentation
| Virual Oral Presentation Slide by Slide |
|
IEEE/ICACT20210130 Slide.14
[Big Slide]
| Oral Presentation |
|
|
|
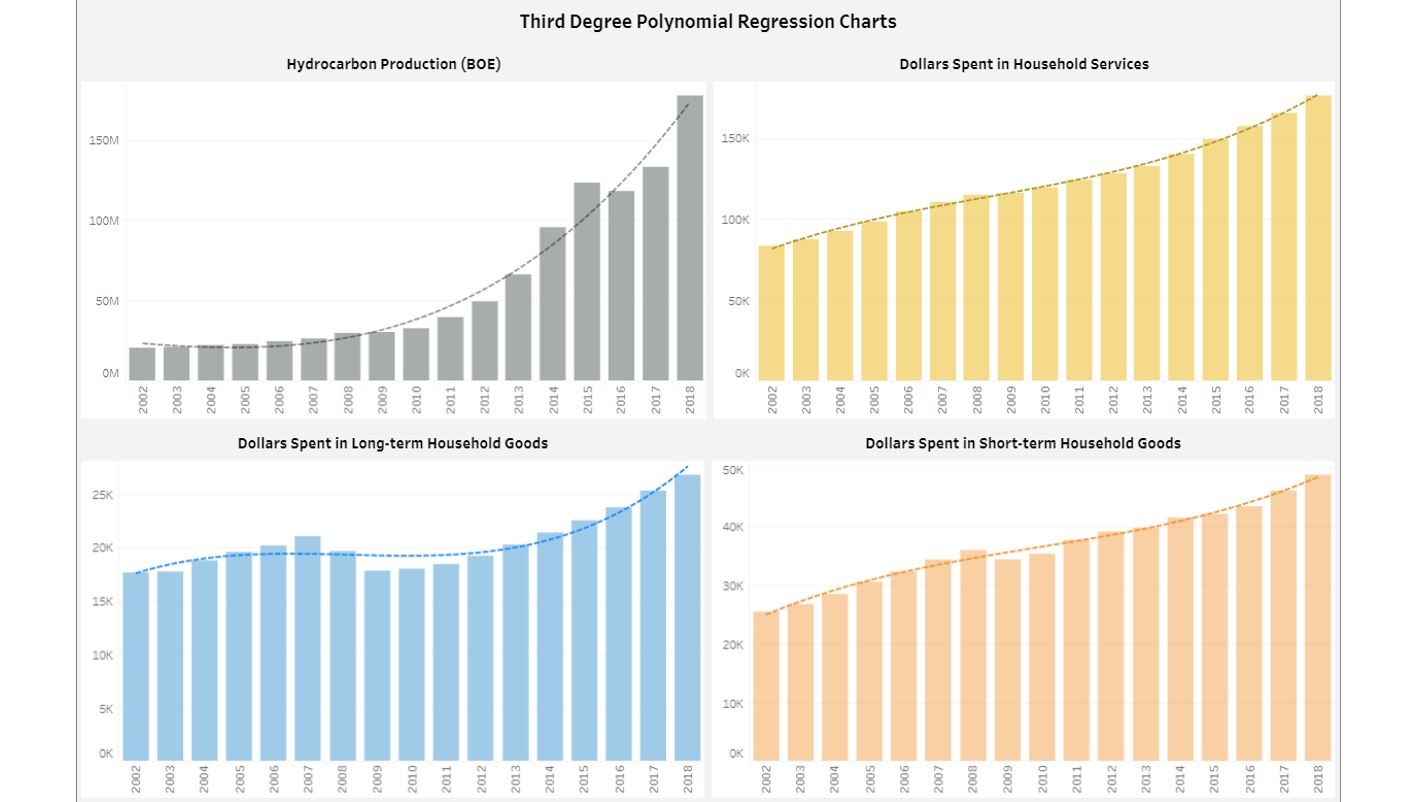
Four visualizations are shown for HC production, household services expenditures, and household long and short term goods. A third-degree polynomial regression model was fit for each dataset, versus time, using Tableau¡¯s built-in features. | |
| [Go to Next Slide] |