 |
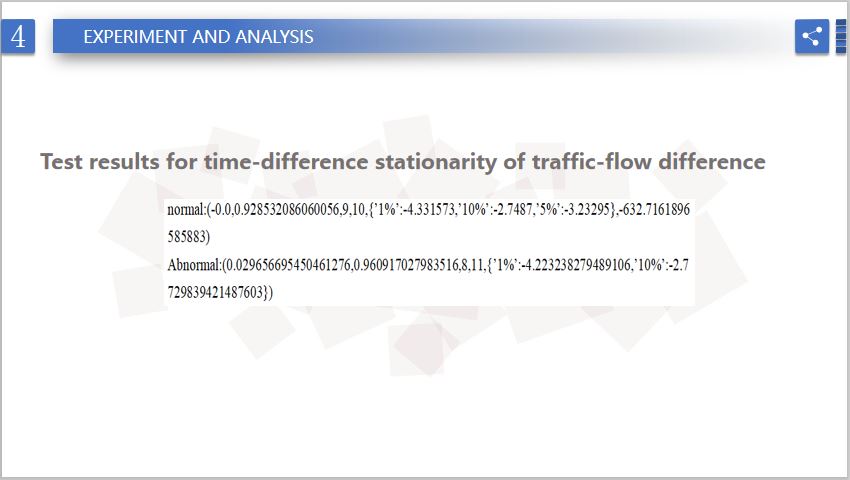
It can be seen from Fig. 6 and Fig. 7 that in the case of traffic anomalies, the data graphic method shows that the time series of traffic flow difference on a section of motorway present a large trend change before and after a certain moment, and the declining trend becomes more and more obvious. The occurrence of traffic anomalies between adjacent nodes results in significant differences in traffic flow passing through adjacent nodes.The stability test of the time series is carried out and the original hypothesis is accepted. According to formula , the probability of traffic anomaly is calculated as 55%, which is greater than 50% of the threshold originally set.
|
 IEEE/ICACT20210155 Slide.14
[Big Slide]