 IEEE/ICACT20210165 Slide.14
[Big Slide]
Oral Presentation
| Virual Oral Presentation Slide by Slide |
|
IEEE/ICACT20210165 Slide.14
[Big Slide]
| Oral Presentation |
|
|
|
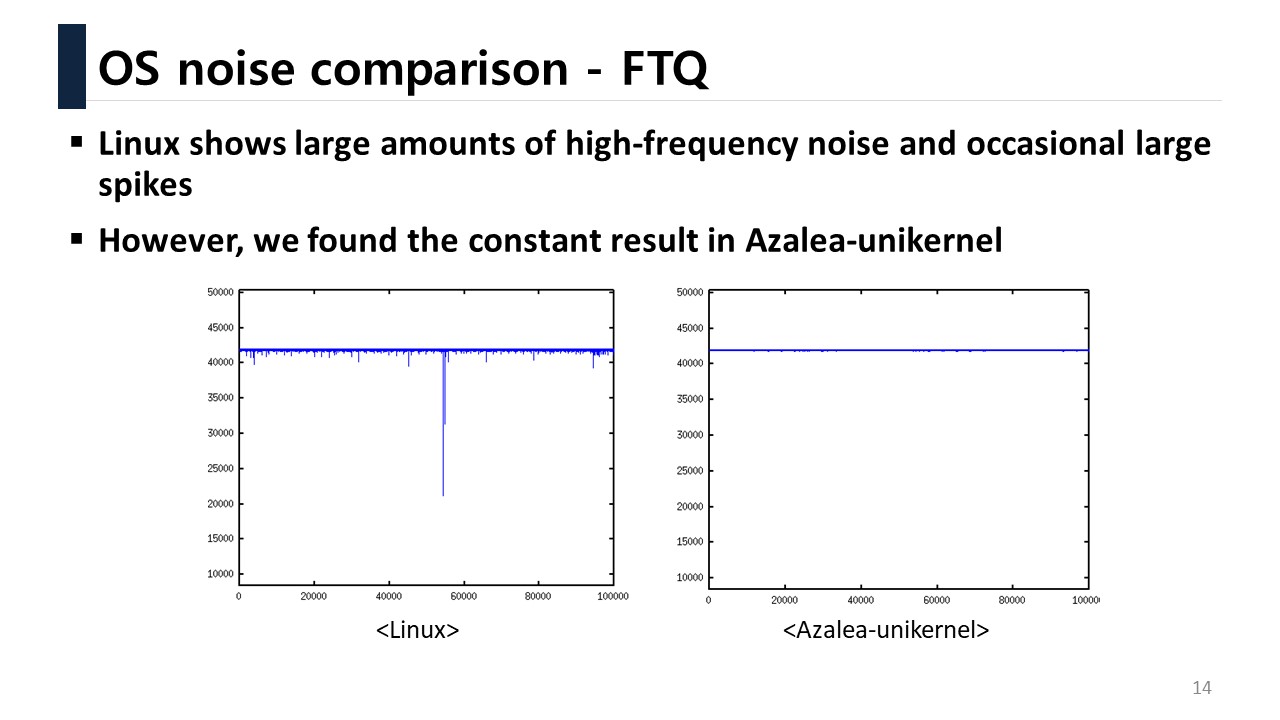
This figure is the result of executing FTQ on Linux and Azalea-unikernel. The X-axis represents the sample number, and the Y-axis represents the number of iterations performed during the time quantum. Linux shows large amounts of high-frequency noise and occasional large spikes. However, we found the constant result in Azalea-unikernel. | |
| [Go to Next Slide] |