 |
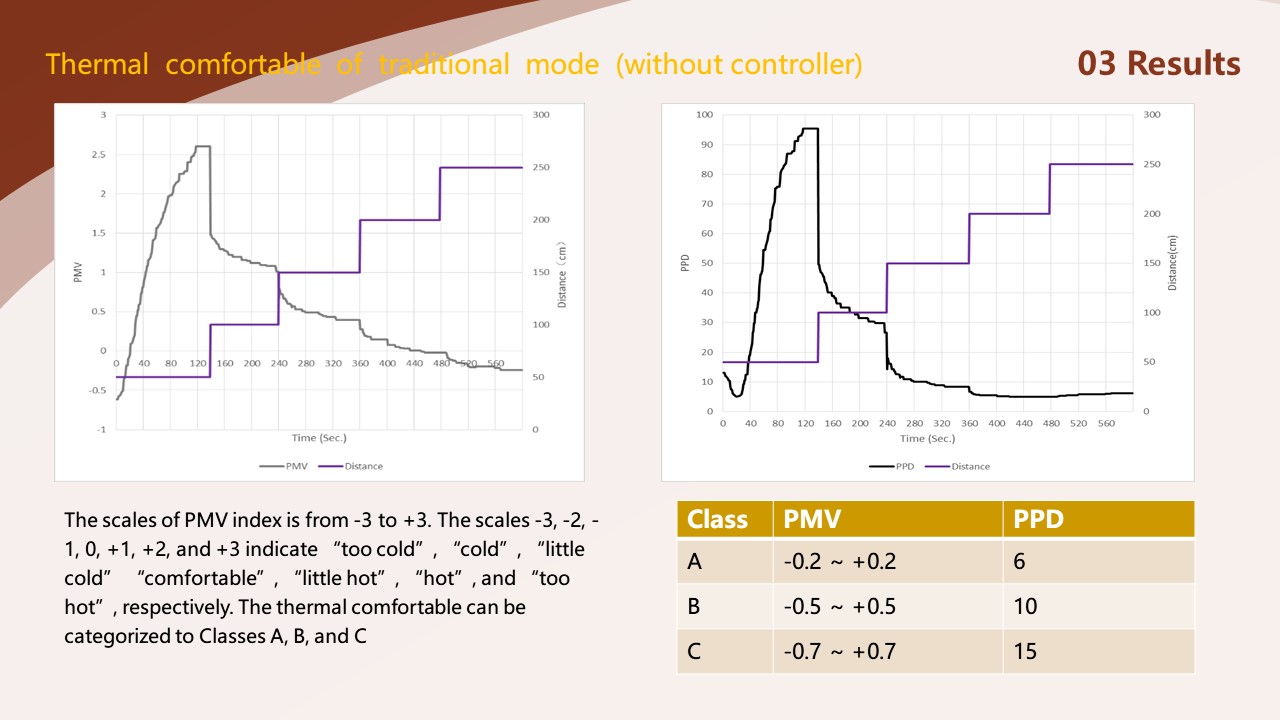
The sequence of measured PMV index without output power control radiator (traditional radiator) was presented in Fig. 4. The X axis is time in sec. and left Y axis is the value of PMV index. In addition, the right Y axis is the distance between heat radiator and the subject, i.e. d. Therefore, d was adjusted with the step of 50 cm from d=50 cm to d=250 cm in every 2 minutes. In the duration of 0 to 2 minutes, the heat radiator turned on, and the PMV index changed from -0.5 to +2.5 rapidly. Obviously, d is too small so that the user¡¯s temperature increased very speedy. In the duration of 2 to 4 minutes, the value of PMV index reduced between +1 and +1.5 when d=100 cm. Consequently, it went to the next 2 minutes. the value of PMV index reduced between +0.5 and +1.0 when d=150 cm. In the duration of 6 to 8 minutes, the value of PMV index reduced between 0 and +0.5 when d=200 cm. Finally, in the duration of 8 to 10 minutes, the value of PMV index reduced between -0.5 and 0 when d=250 cm. |
 IEEE/ICACT20220117 Slide.14
[Big Slide]