 |
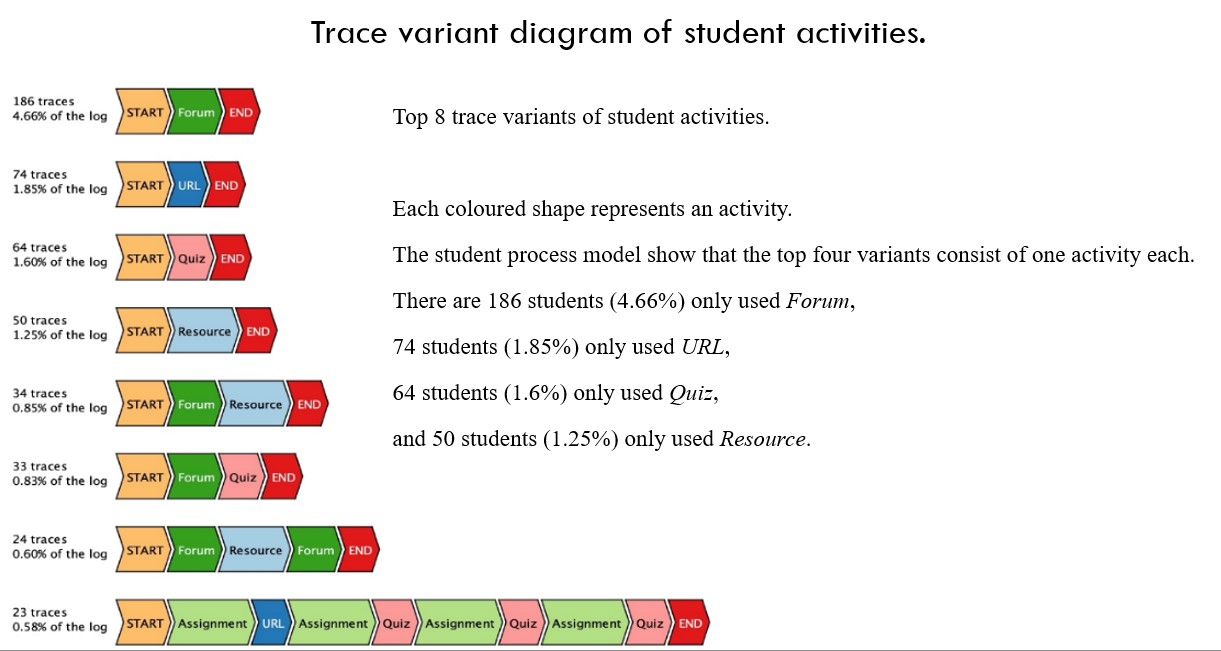
More detailed analysis was done by examining the trace variant diagram. The figure shows the top 8 most frequent trace variants covers 488 out of 3,994 traces (12.22%). Each row in a trace variant diagram represents a trace variant. The rows in the trace variant diagram are ordered from the most frequent variant to the least frequent one. Each coloured shape represents an activity. The student process model show that the top four variants consist of one activity each. There are 186 students (4.66%) only used Forum, 74 students (1.85%) only used URL, 64 students (1.6%) only used Quiz, and 50 students (1.25%) only used Resource. |
 IEEE/ICACT20220197 Slide.14
[Big Slide]
[YouTube]
IEEE/ICACT20220197 Slide.14
[Big Slide]
[YouTube]