 |
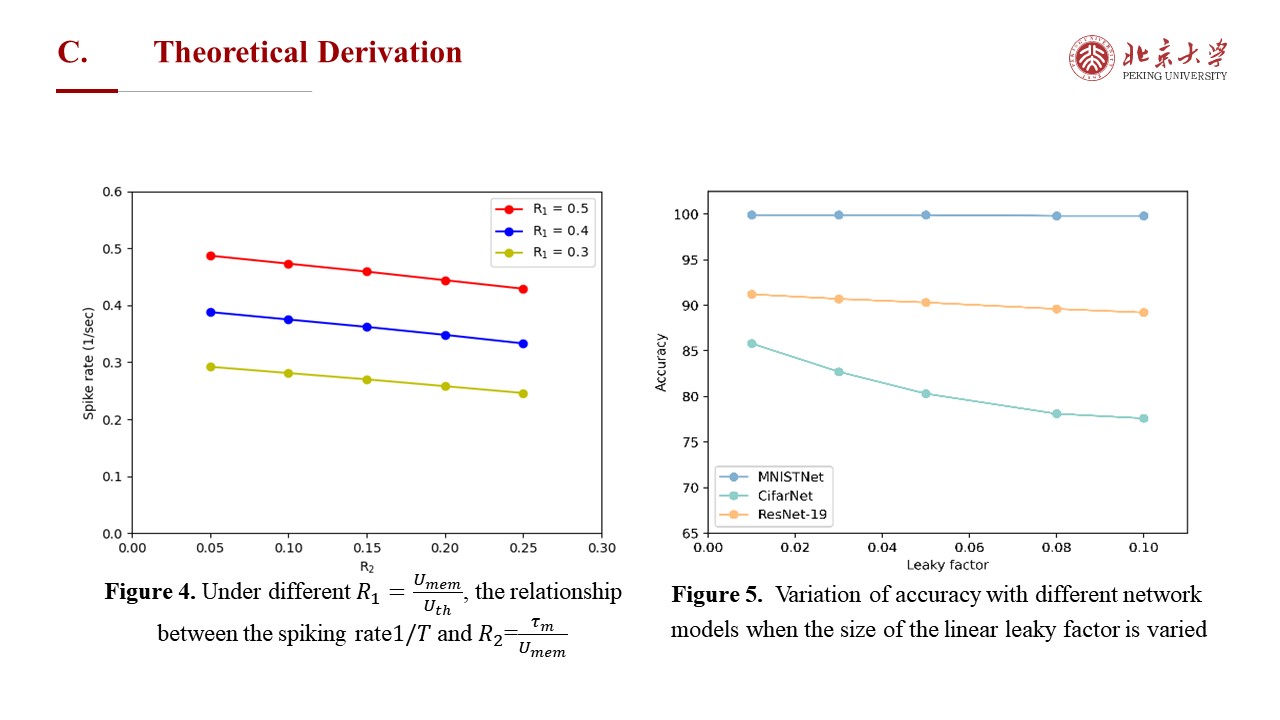
Figure 4 is a function plot of the 𝑅_1, 𝑅_2 and spiking rate 1/T that we have drawn. Under different 𝑅_1, the spiking rate 1/𝑇 shows a decreasing trend when 𝑅_2 varying from 0.05 to 0.25, which means, the spiking rate decreases and the sparsity of the network increases as the leakage increases. In addition, we find that the variation of the linear leakage parameter affects the classification accuracy of the network to some extent. Figure 5 shows the variation of accuracy with different network models when the size of the linear leaky factor is varied.
|
 IEEE/ICACT20230030 Slide.14
[Big Slide]