 |
To profile any new input power usage data, we measure DTW similarity between this data points set and both load patterns sets of WoLP and WeLP,
Depends on the measured similarity, the load data is categorized
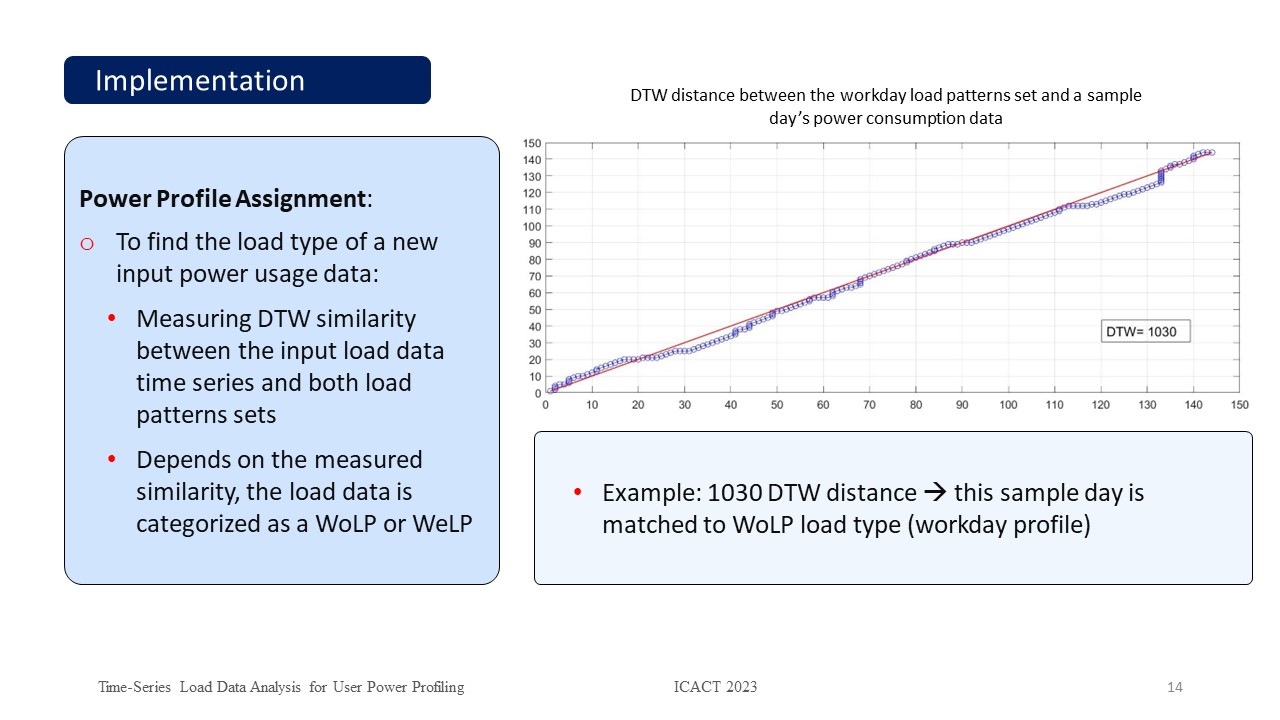
This figure shows DTW distance, warp path, and the straight-line fit between the load data points of the refrigerator measured on a sample day and the load data sequences of the predefined workday,
In this example, there is 1030 DTW distance between these load data points sets and this sample day is matched to WoLP load type and is profiled as a workday,
|
 IEEE/ICACT20230034 Slide.14
[Big Slide]
[YouTube]