 IEEE/ICACT20230044 Slide.14
[Big Slide]
[YouTube] Oral Presentation
| Virual Oral Presentation Slide by Slide |
|
IEEE/ICACT20230044 Slide.14
[Big Slide]
[YouTube] |
Oral Presentation |
|
|
|
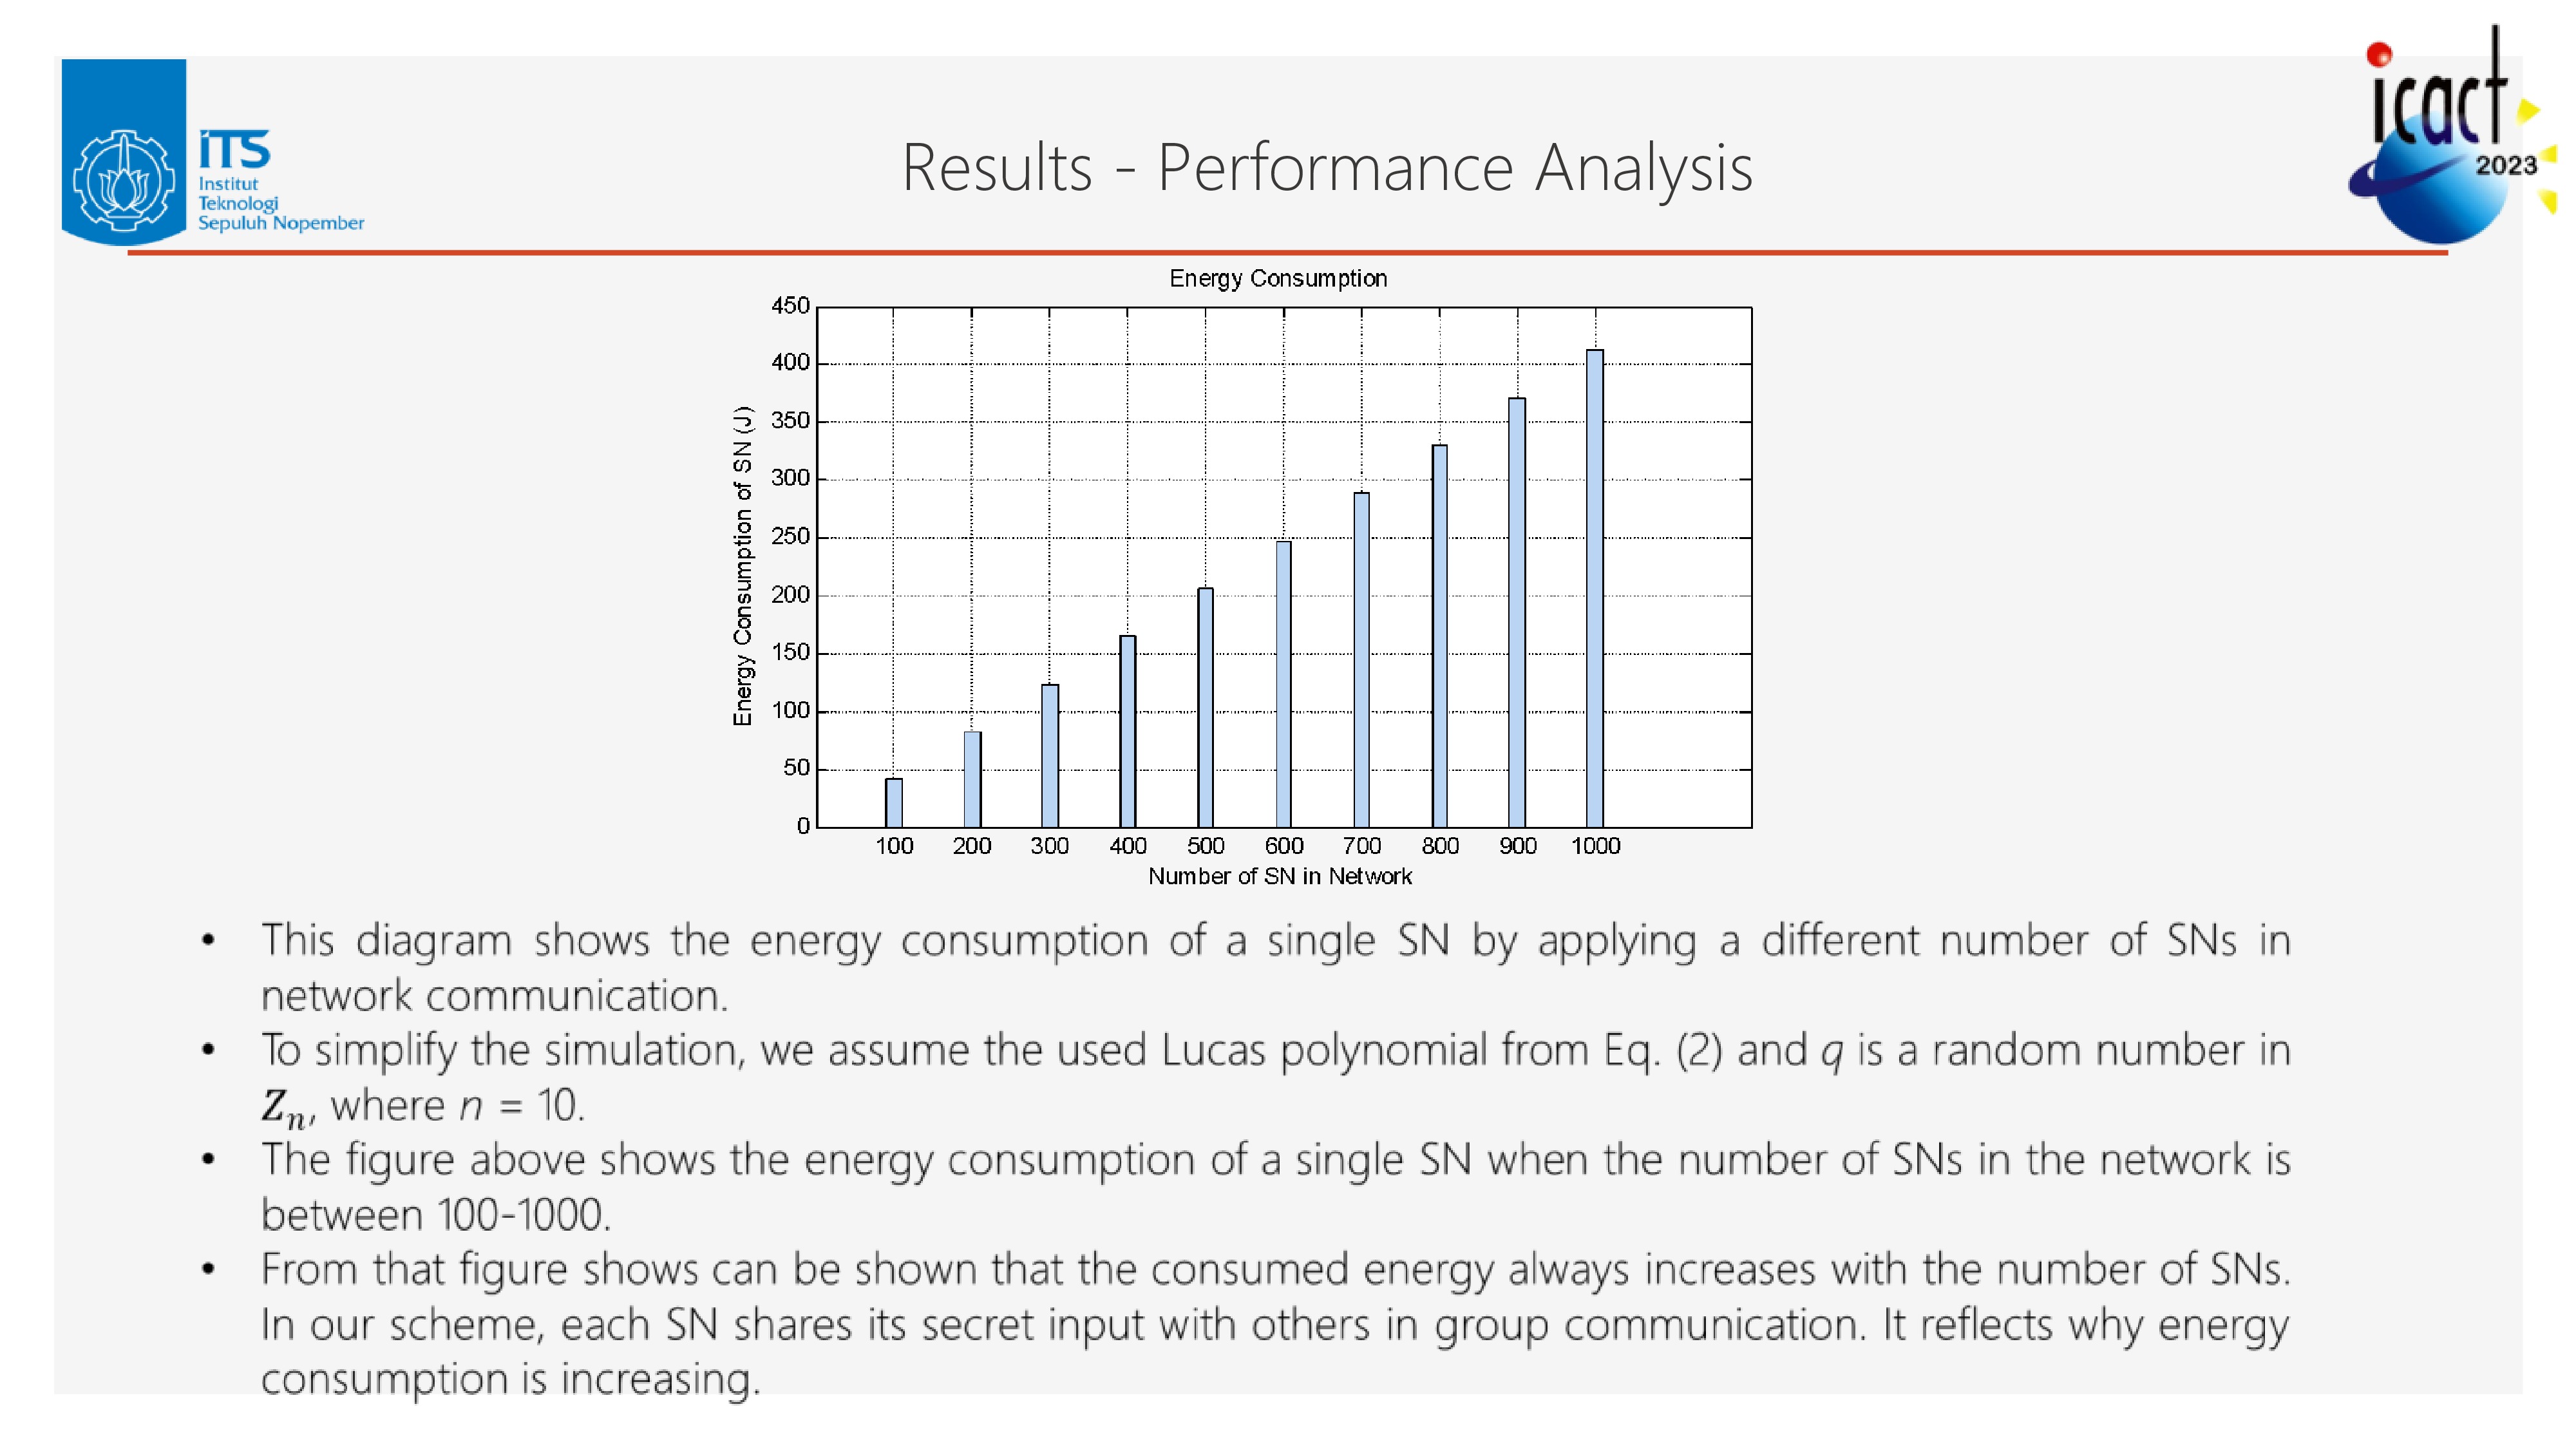
The figure shows the energy consumption of a single SN when the number of SNs in the network is between 100-1000. From that figure shows can be shown that the consumed energy always increases with the number of SNs. In our scheme, each SN shares its secret input with others in group communication. It reflects why energy consumption is increasing. | |
| [Go to Next Slide] |