 IEEE/ICACT20230047 Slide.14
[Big Slide]
[YouTube] Oral Presentation
| Virual Oral Presentation Slide by Slide |
|
IEEE/ICACT20230047 Slide.14
[Big Slide]
[YouTube] |
Oral Presentation |
|
|
|
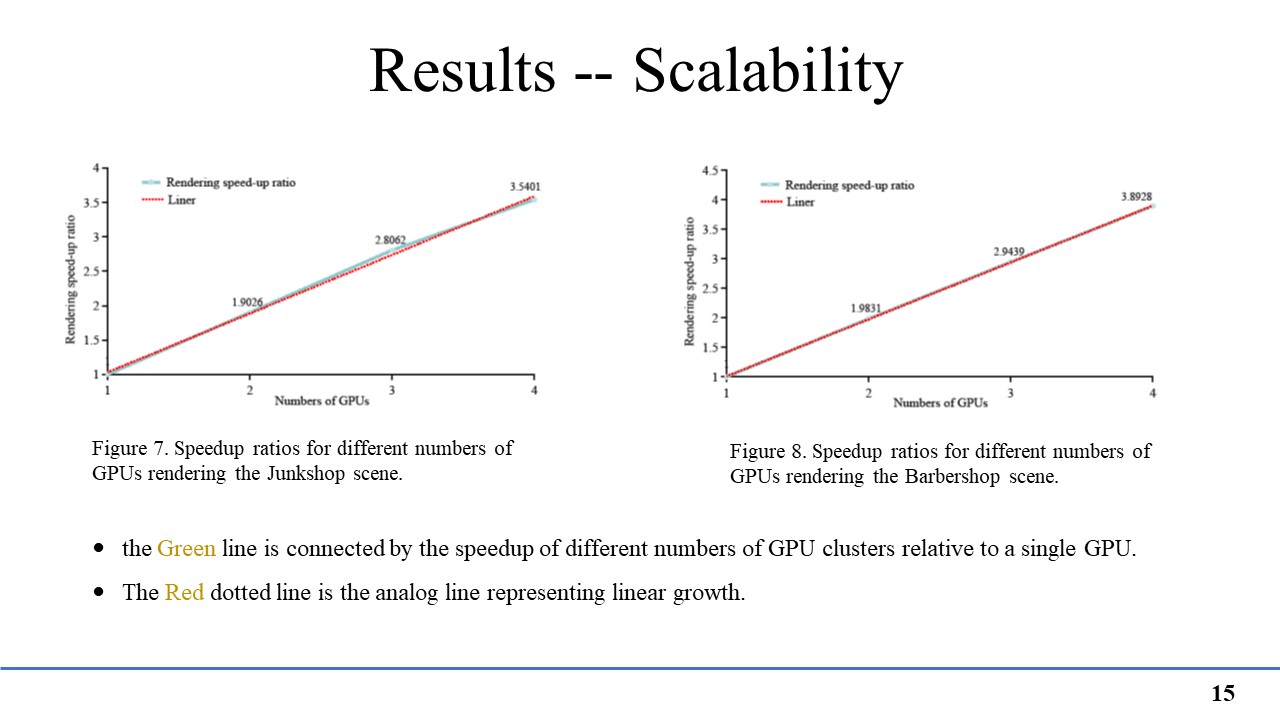
Figure 7,8 shows the speedup ratios for different numbers of GPUs rendering the Junkshop and Barbershop scenes respectively. In both figures, the Green line is connected by the speedup of different numbers of GPU clusters relative to a single GPU. The Red dotted line is the analog line representing linear growth. | |
| [Go to Next Slide] |