 |
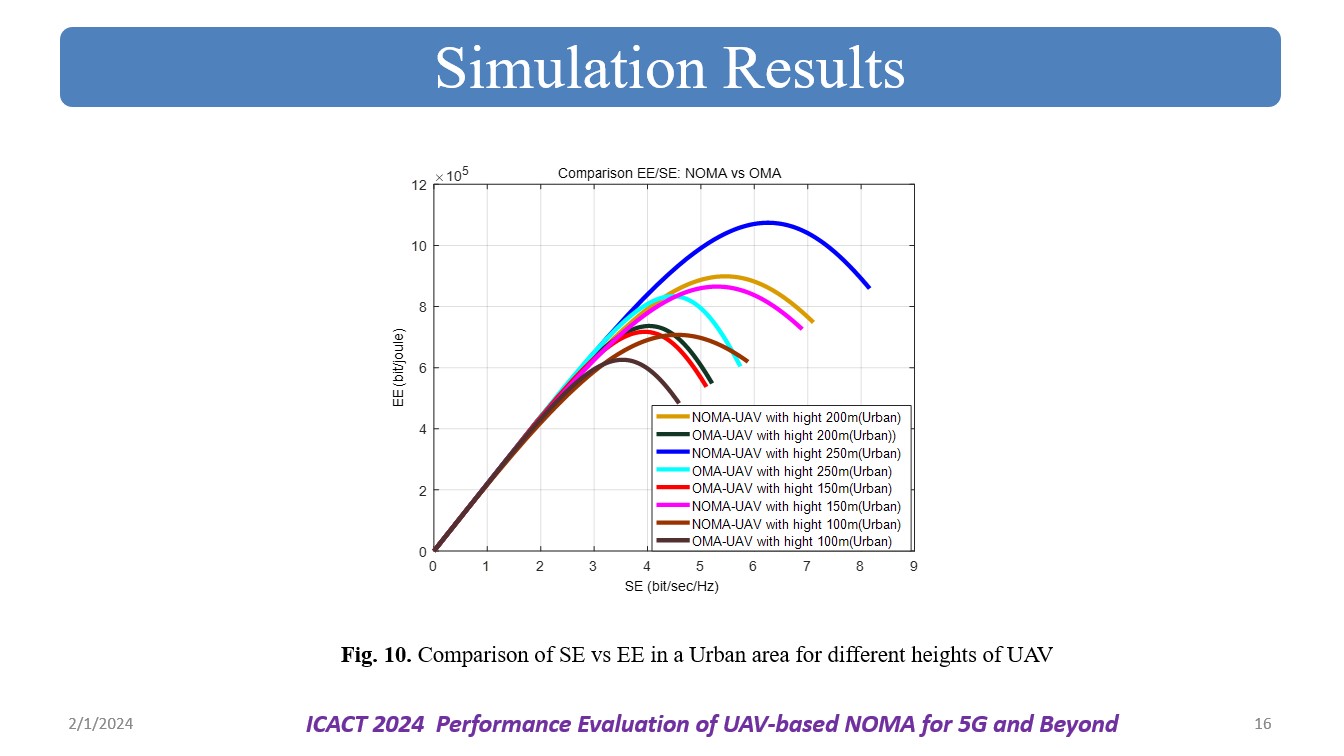
The plot "Comparison of SE vs EE in an urban area for different heights of UAV-NOMA" likely presents a graphical representation illustrating how the Spectral Efficiency and Energy Efficiency of an OMA and NOMA systems, deployed using UAVs at different heights, perform in an urban environment. The plot helps in assessing the trade-offs between data transmission capacity and energy consumption for the given scenario in an urban setting. Here also, we can observe that at all the heights of UAV, the proposed NOMA performance is better compared to the exiting OMA system. |
 IEEE/ICACT20240040 Slide.14
[Big Slide]
[YouTube]